
Overview
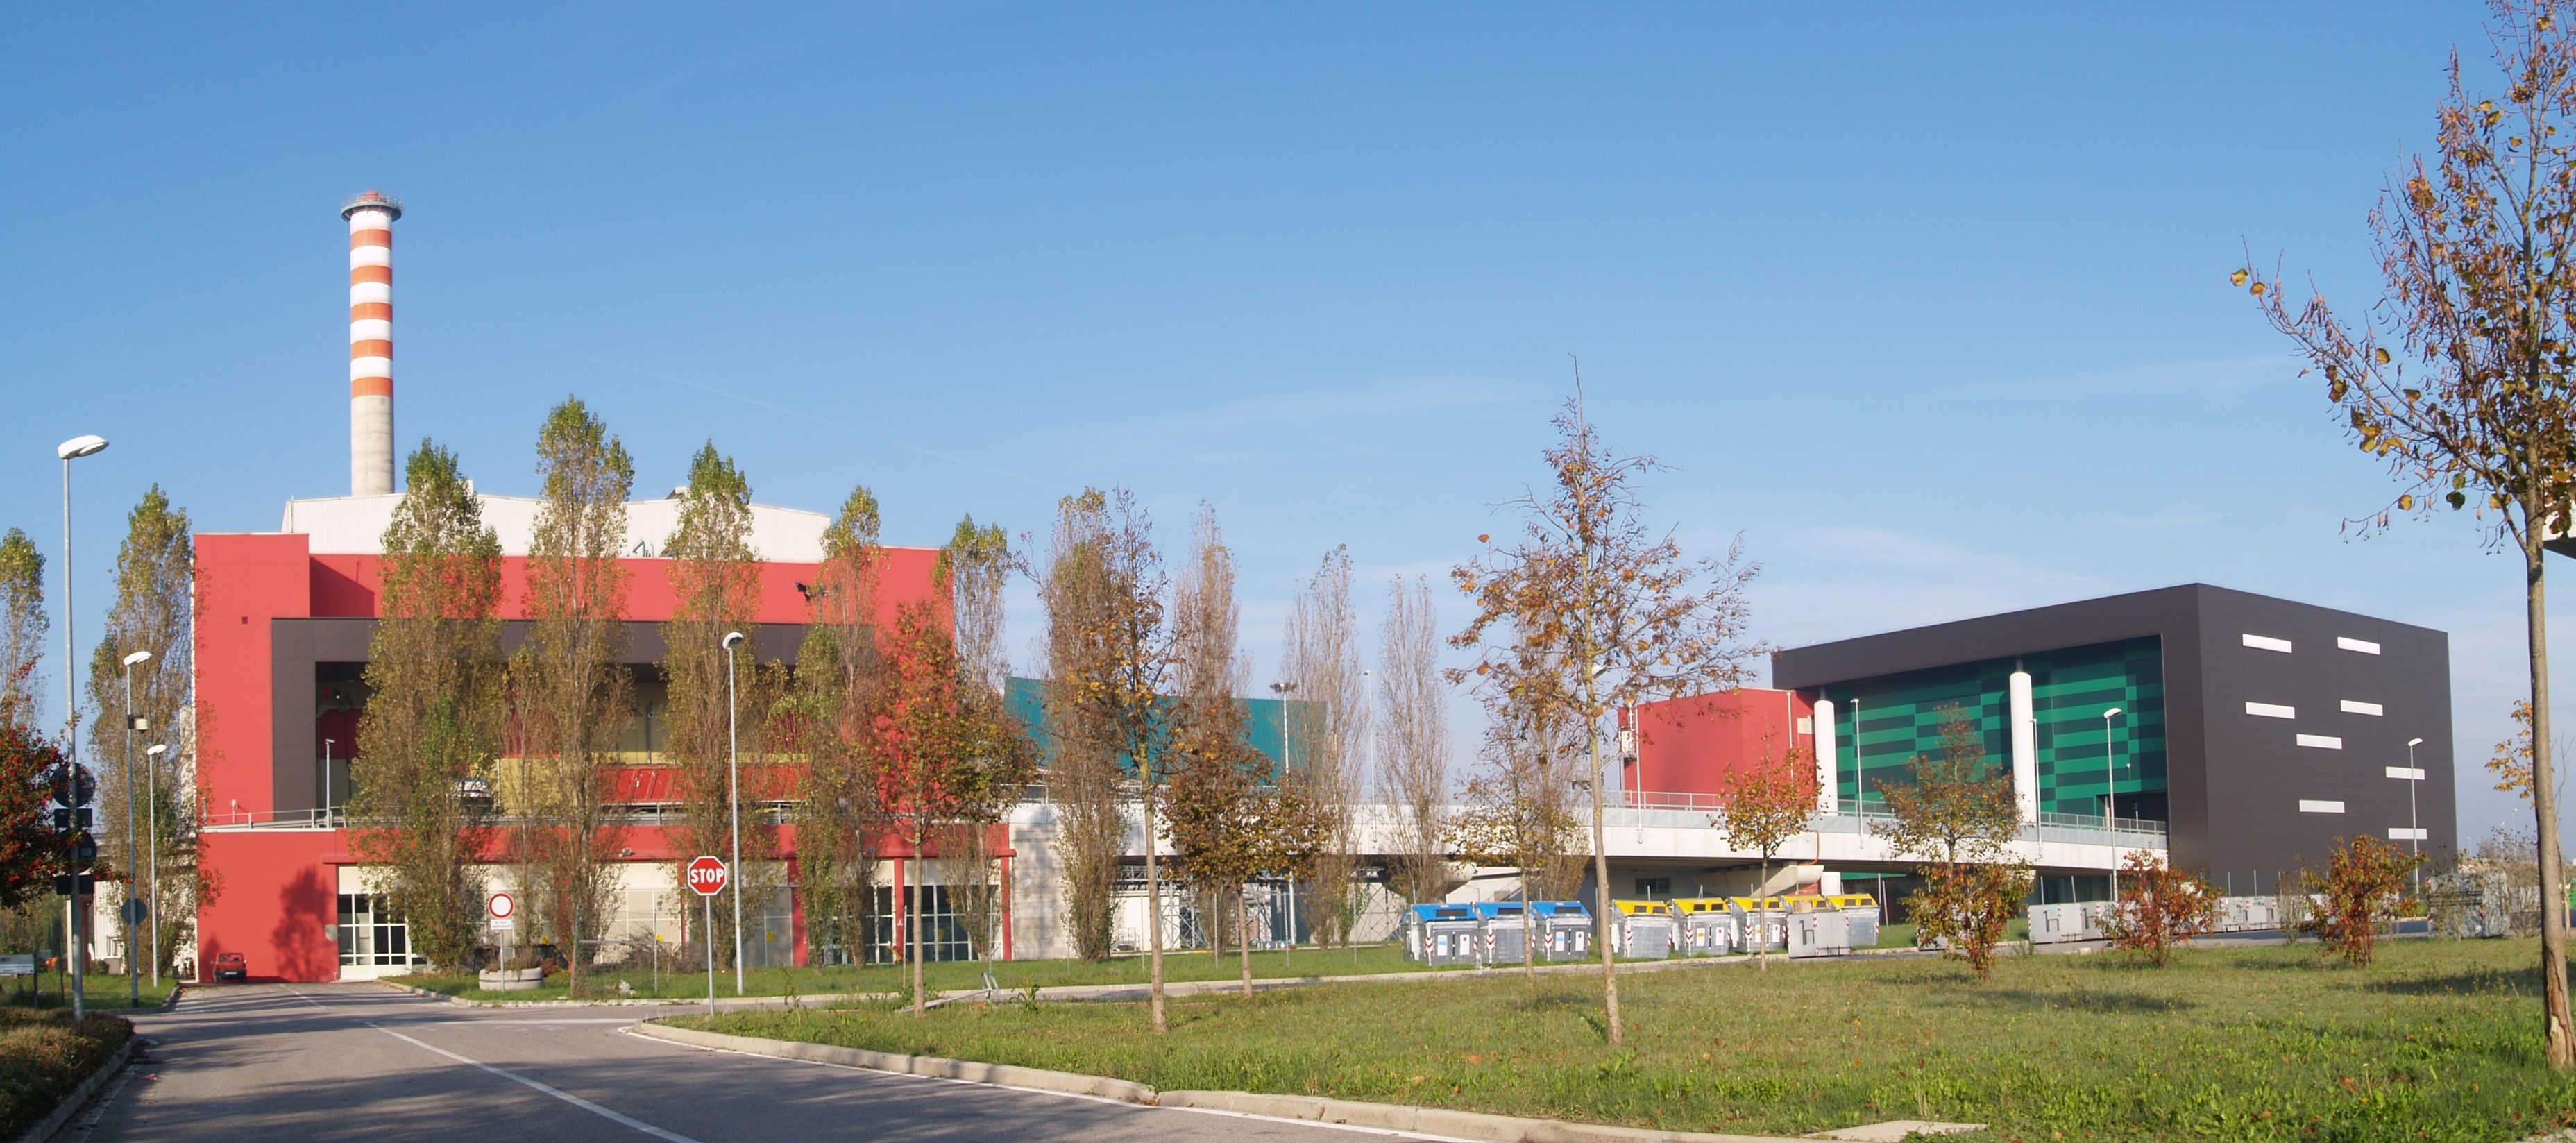
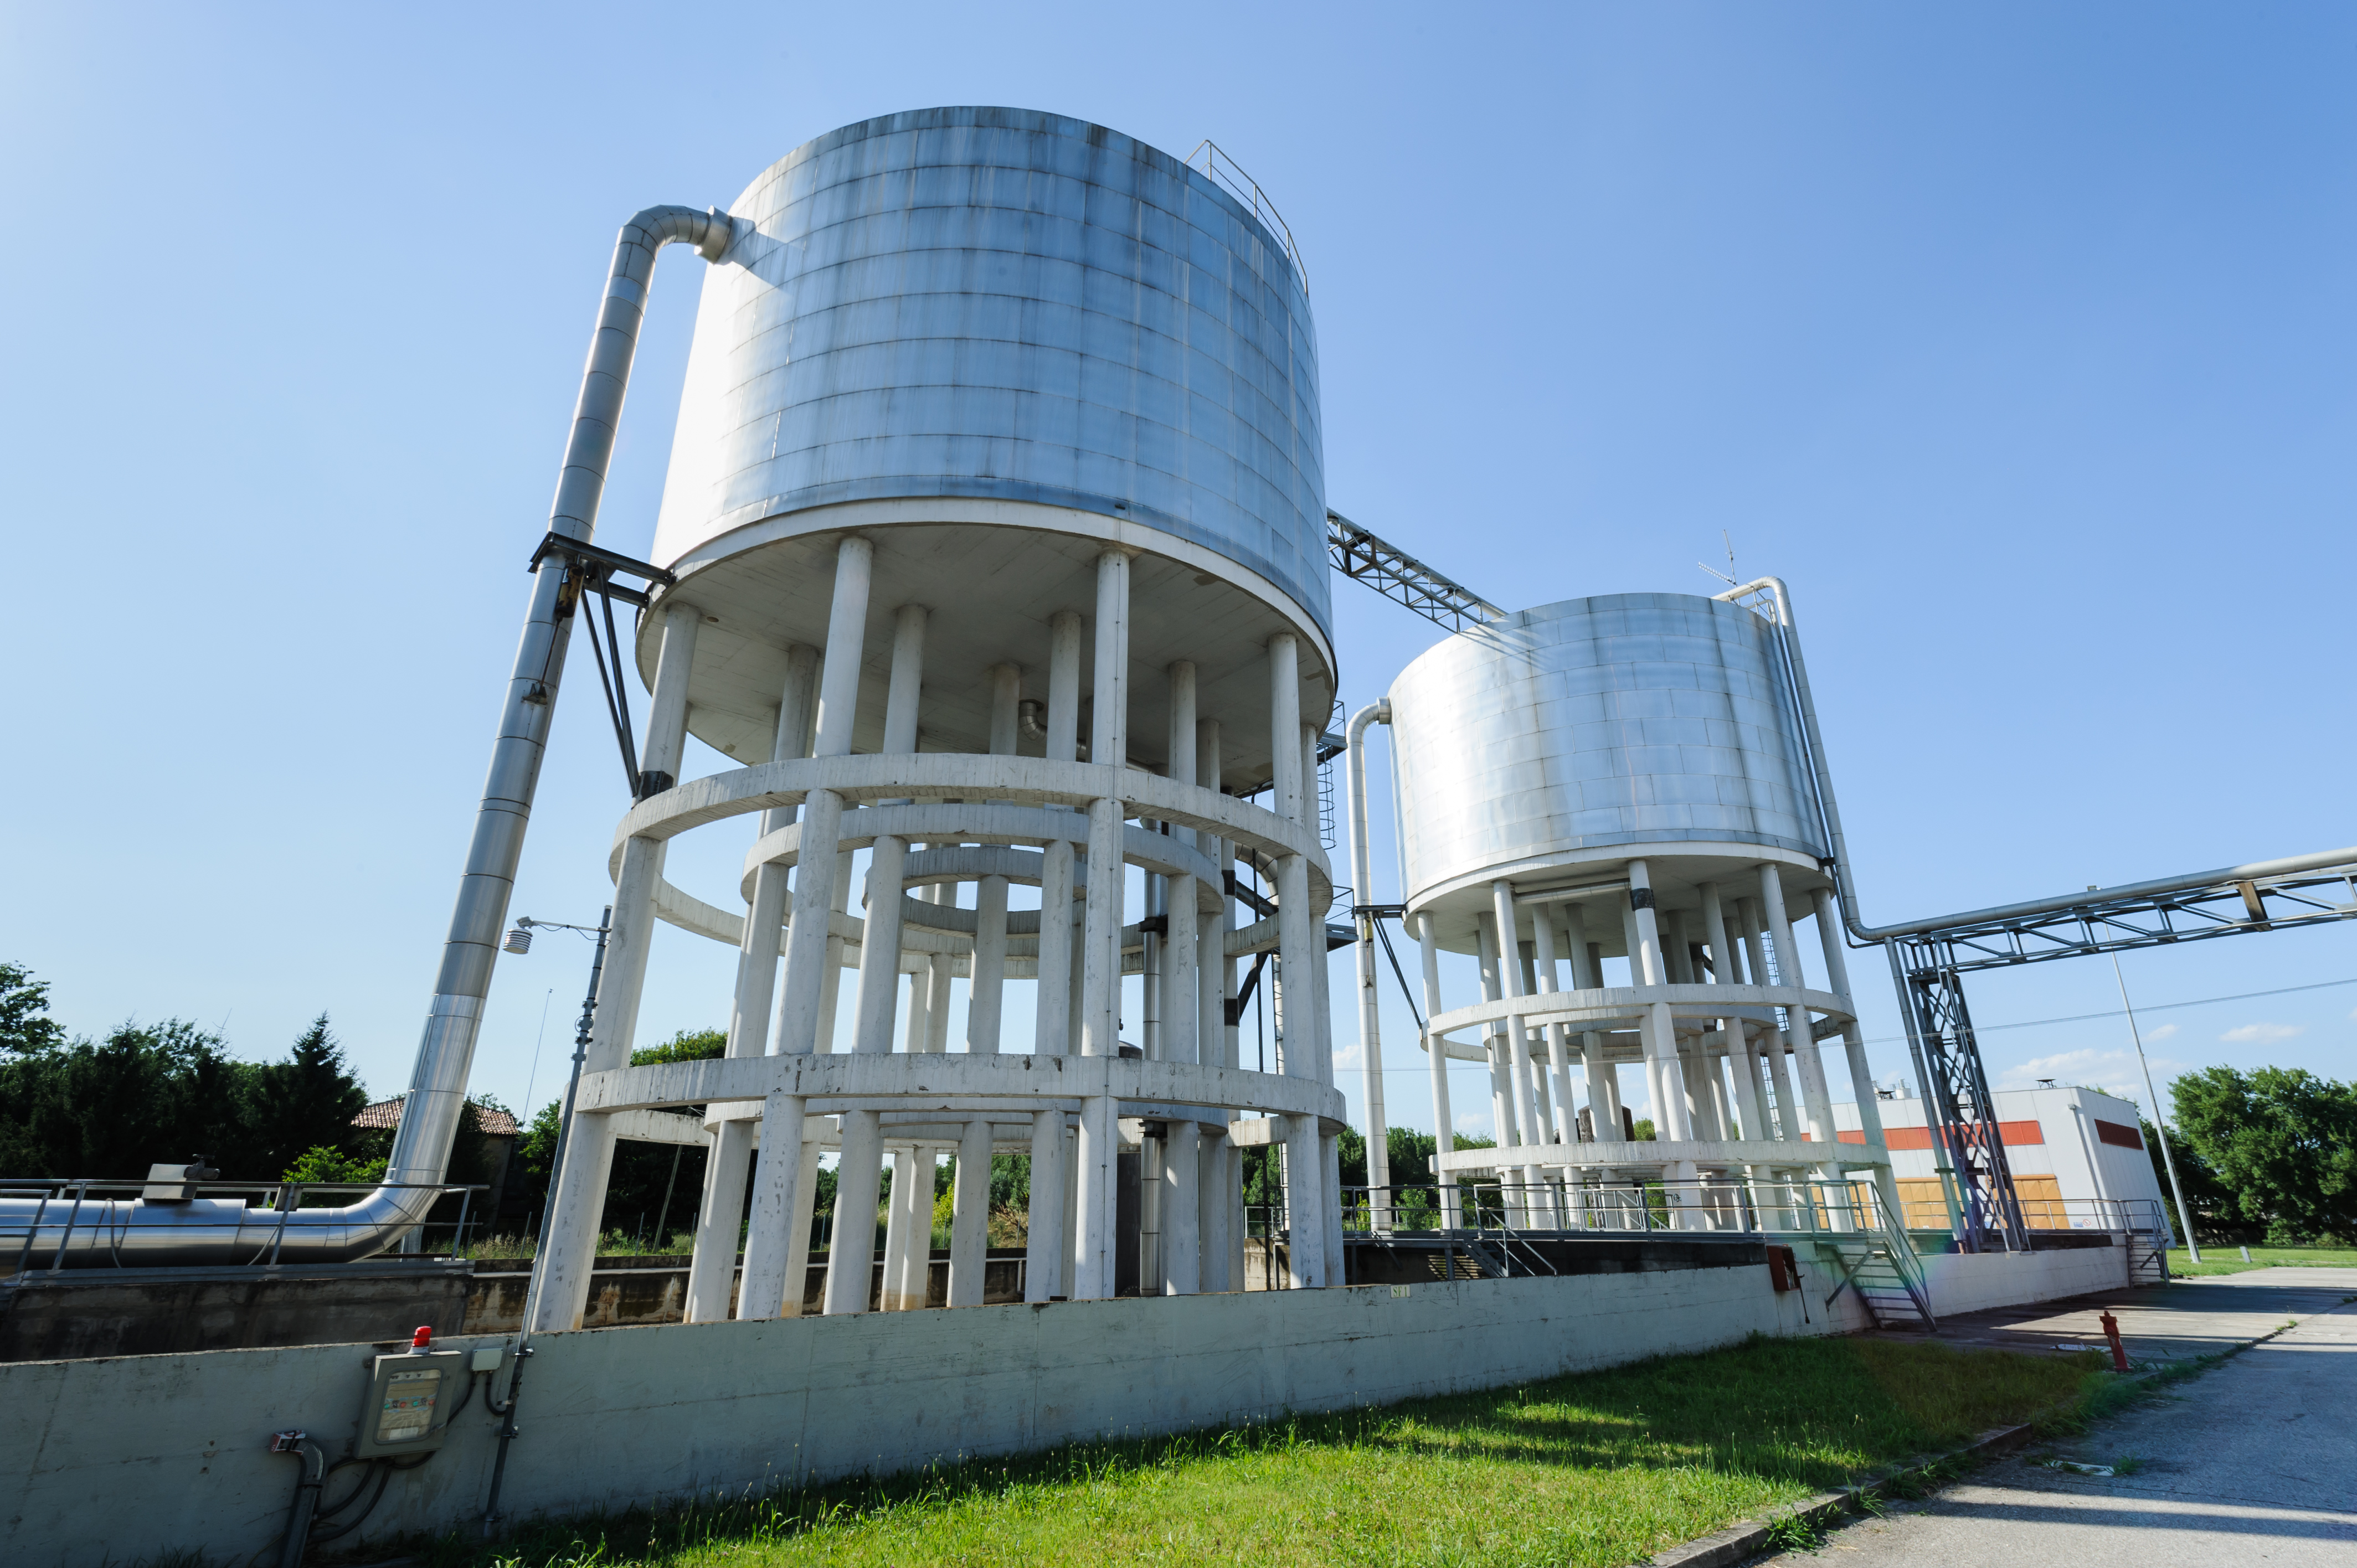
The Ferrara waste to energy plant is located inside the “geothermal energy” complex, where Ferrara's district heating plant is also located. The plant, which has been operating since 1994, recovers the heat generated by burning waste and converts it into electricity and thermal energy. Indeed, waste to energy plants are incinerators that allow the heat of combustion to be converted into energy, taking advantage of the renewable fuel present in waste.
The district heating plant's operations can be adjusted based on climatic conditions and user consumption. If needed, part of the steam generated by combustion is discharged from the turbine and transfers energy to the adjacent district heating plant. The main purpose is to produce, accumulate and distribute thermal energy to the residential network from three sources: geothermal energy, waste to energy treatment and the methane gas plant.
Of the production sources used by the district heating plant, the waste to energy plant is in second place in terms of priority of intervention. The first generation source is the thermal energy originating from geothermal fluid, extracted from the subsoil through two wells. A third source, used to produce hot water, is the heating plant consisting of seven methane fuelled boilers, which are used only in the event that the first two sources are insufficient to meet the demand.
The waste to energy plant has been using two new waste to energy lines since 2008. These were built, in accordance with the provincial waste management programme, to handle the disposal of unseparated municipal waste and non hazardous special waste produced in the province of Ferrara. The maximum authorised capacity is 142,000 tonnes per year of non hazardous municipal and special waste.
Page update 14 September 2022
Form
Environmental compatibility in compliance with regulations in force (Legislative Decree 152/06)
-
Number of waste to energy lines
2 -
Total thermal capacity
about 55.8 MWt -
Combustion technology
water cooled moving grate furnaces -
Waste disposal capacity
max 460 t/g with net calorific value (NCV) equal to 10,465 kJ/kg -
Annual operation
8.000 hours -
Nominal electrical power
13.0 MWe -
Disposal and recovery codes
R1 -
Type of waste accepted
municipal waste; non hazardous special waste

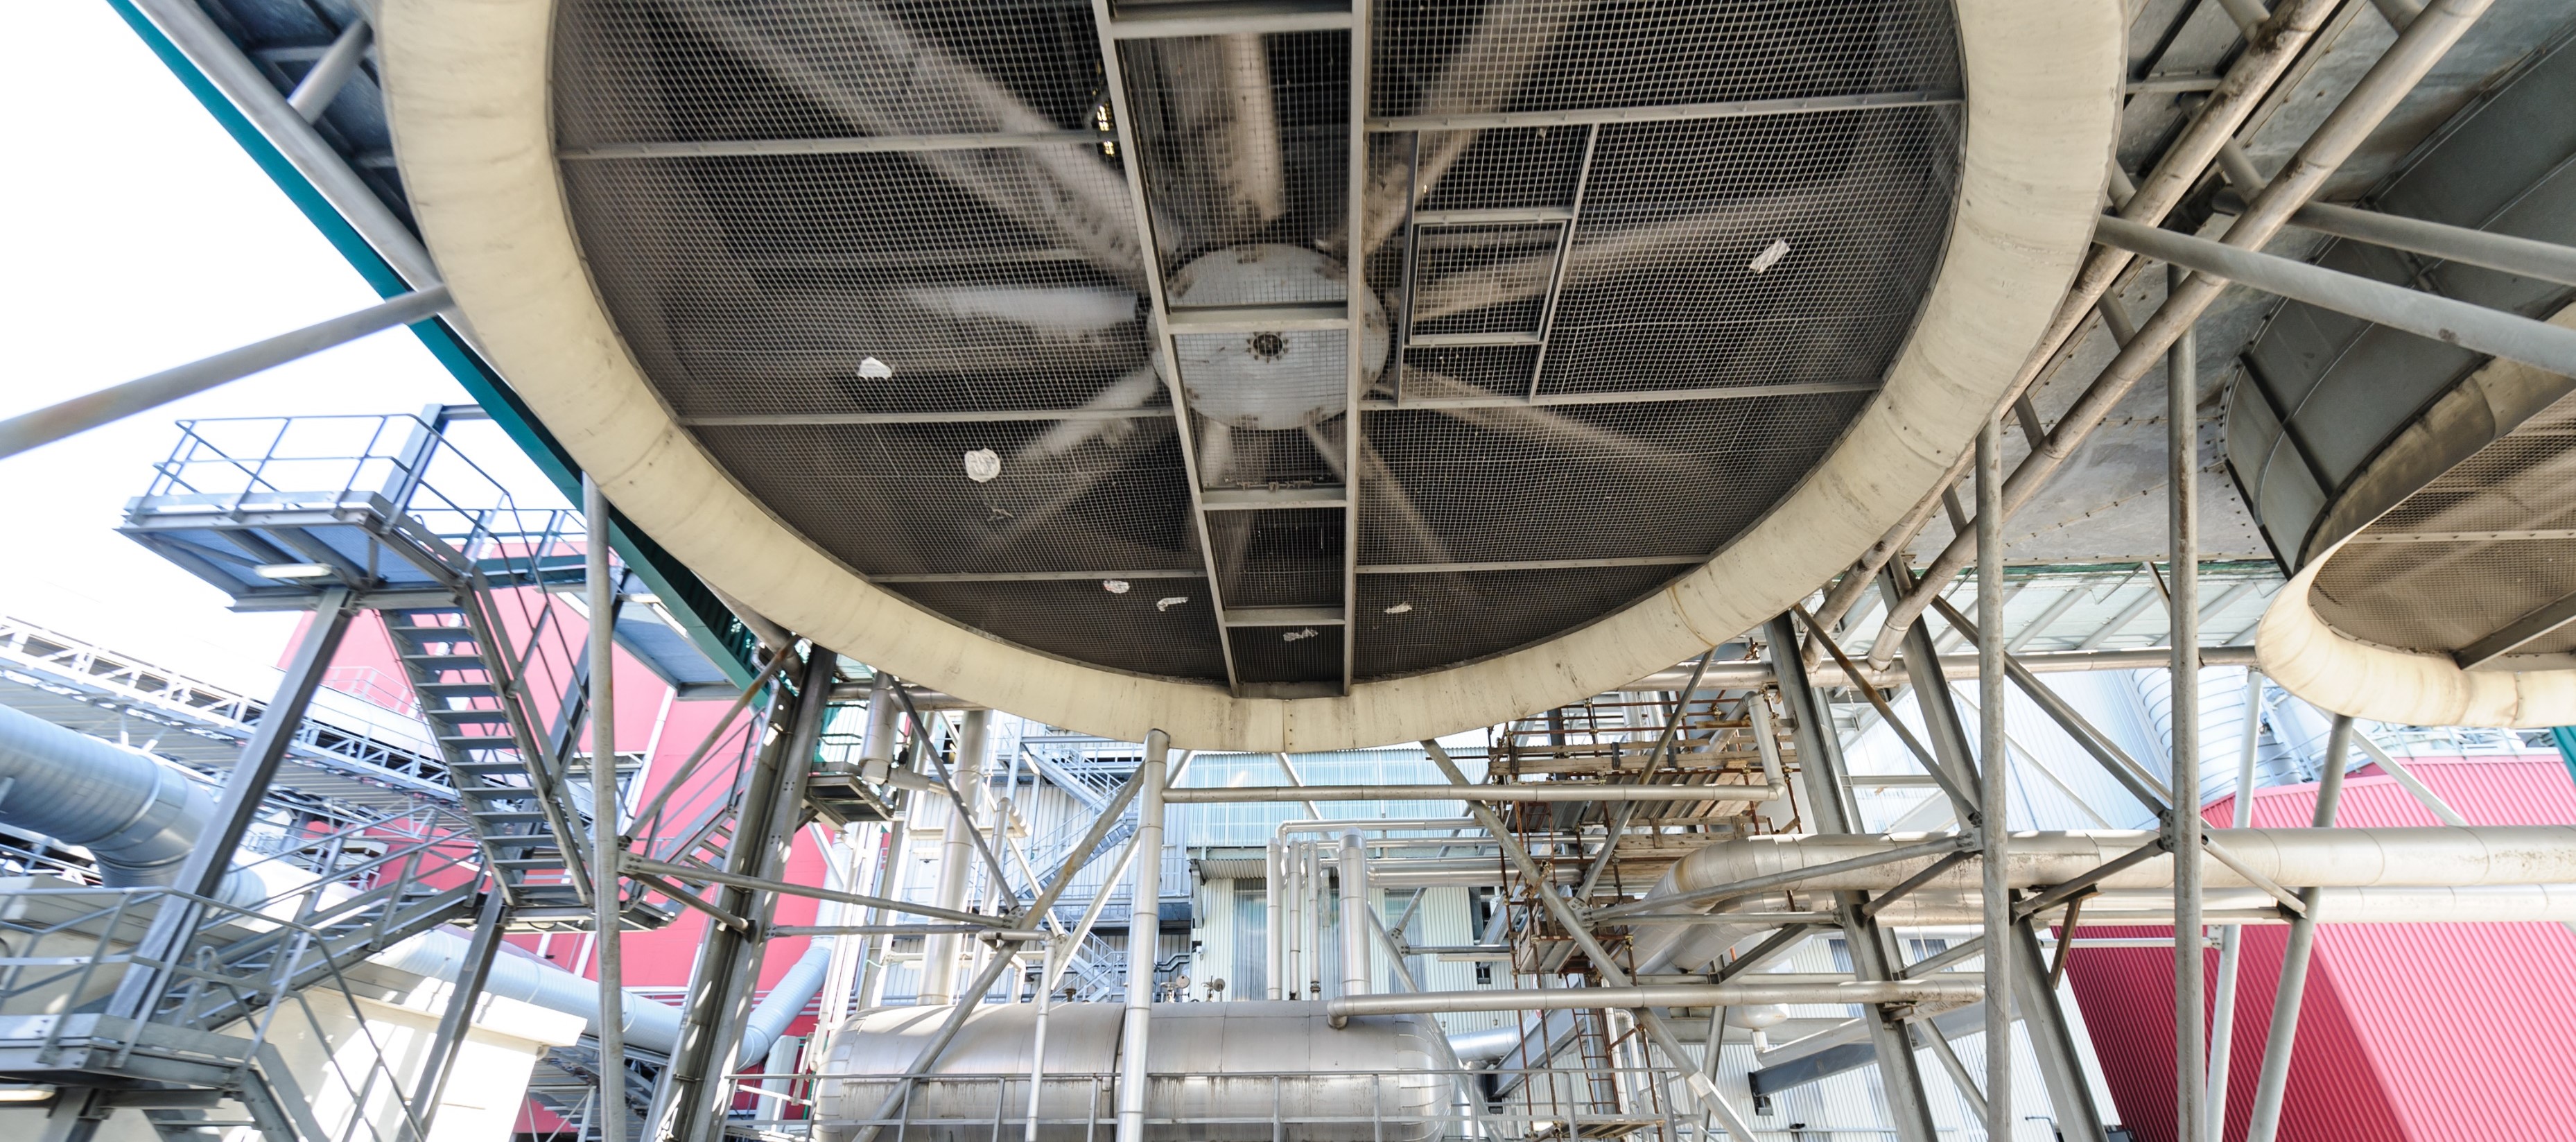
The water tube boiler has the dual function of recovering the heat contained in the fumes and the relative cooling for the next purification phases. The fumes enter the boiler at approximately 950 1,000gradiC and exit at approximately 180gradiC, to then be sent for purification.
The plant is equipped with a Continuous Emissions Monitoring System (CEMS) which has automatic analysers functioning 24 hours per day to continuously monitor the quality of atmospheric emissions. A suitably heated sample probe continuously transports a sample of the gas from the plant´s chimney to the analysis booth where the instrumentation is installed. The sample is put into the Fourier transform infrared spectroscopy (FTIR) analyser, which continuously detects the absorption spectra of the compounds to be measured. A mathematical process is used to compare the spectra with the typical spectra of the substances being investigated. The comparison makes it possible to determine the quantitative values (concentrations) of the elements and compounds analysed. Besides the FTIR system, there are other continuous analysers and meters needed to complete the fume analysis by determining other parameters such as: particles, organic compounds, mercury, oxygen, temperature, flow and pressure. A data acquisition system (SADE) also continuously provides the values obtained by calculating the half-hourly and daily averages of the concentrations measured, which are compared with the maximum admissible limit values set by the Control Bodies. These data are also provided on the group´s website, where they are automatically updated every half hour.
Emissions report average values of the last half hour
| Type of emission | Average values | Status | ||
| ND | 40 | 60 | ND | |
| ND | 50 | 200 | ND | |
| ND | 300 | 400 | ND | |
| ND | 2 | 4 | ND | |
| ND | 20 | 30 | ND | |
| ND | 15 | 20 | ND | |
| ND | 10 | 60 | ND |
Emissions report average daily values
| 10 | 50 | 50 | 200 | 1 | 10 | 10 | 30 | ||||||||||||||||||||||||||||||||||||||||||||||||||||||||||||||||||||||||||||||||||||||||||||
| 50 | 20 | 1 | 5 | ||||||||||||||||||||||||||||||||||||||||||||||||||||||||||||||||||||||||||||||||||||||||||||||||
| 04/05/2024 | Impianto fermo | ||||||||||||||||||||||||||||||||||||||||||||||||||||||||||||||||||||||||||||||||||||||||||||||||||
| 03/05/2024 | Impianto fermo | ||||||||||||||||||||||||||||||||||||||||||||||||||||||||||||||||||||||||||||||||||||||||||||||||||
| 02/05/2024 | Impianto fermo | ||||||||||||||||||||||||||||||||||||||||||||||||||||||||||||||||||||||||||||||||||||||||||||||||||
| 01/05/2024 | Impianto fermo | ||||||||||||||||||||||||||||||||||||||||||||||||||||||||||||||||||||||||||||||||||||||||||||||||||
| 30/04/2024 | Impianto fermo | ||||||||||||||||||||||||||||||||||||||||||||||||||||||||||||||||||||||||||||||||||||||||||||||||||
| 29/04/2024 | Impianto fermo | ||||||||||||||||||||||||||||||||||||||||||||||||||||||||||||||||||||||||||||||||||||||||||||||||||
| 28/04/2024 | Impianto fermo | ||||||||||||||||||||||||||||||||||||||||||||||||||||||||||||||||||||||||||||||||||||||||||||||||||
| 27/04/2024 | Impianto fermo | ||||||||||||||||||||||||||||||||||||||||||||||||||||||||||||||||||||||||||||||||||||||||||||||||||
| 26/04/2024 | Impianto in avviamento o fermata | ||||||||||||||||||||||||||||||||||||||||||||||||||||||||||||||||||||||||||||||||||||||||||||||||||
| 25/04/2024 | Impianto fermo | ||||||||||||||||||||||||||||||||||||||||||||||||||||||||||||||||||||||||||||||||||||||||||||||||||
Select the year
Periodic self-checks for micropollutants - Year 2022
| TIPO EMISSIONE | Linea 2 | limiti aia | Limiti 152/06 |
| Cd+Tl (mg/Nm3) | 0,00080 | 0,02 | 0,05 |
| Hg (mg/Nm3) | 0,00021 | 0,05 | 0,05 |
| Metalli (mg/Nm3) | 0,00603 | 0,3 | 0,5 |
| Diossine (ng/Nm3) | 0,00015 | 0,05 | 0,1 |
| IPA (mg/Nm3) | 0,000005 | 0,01 | 0,01 |
| PCB (ng/Nm3) | 0,000228 | 0,08 | 0,1 |
Select the year
Emissions report average values of the last half hour
| Type of emission | Average values | Status | ||
| 0,91 | 40 | 60 | OK | |
| 0 | 50 | 200 | OK | |
| 40,9 | 300 | 400 | OK | |
| 0 | 2 | 4 | OK | |
| 0 | 20 | 30 | OK | |
| 0,37 | 15 | 20 | OK | |
| 0 | 10 | 60 | OK |
Emissions report average daily values
| 10 | 50 | 50 | 200 | 1 | 10 | 10 | 30 | |
| 50 | 20 | 1 | 5 | |||||
| 04/05/2024 | 1,38 | 4,78 | 0,27 | 45,78 | 0,12 | 0,35 | 0,41 | 0,2 |
| 03/05/2024 | 1,46 | 4,25 | 0,27 | 50,86 | 0,12 | 0,35 | 0,44 | 0,2 |
| 02/05/2024 | 1,29 | 5,22 | 0,27 | 41,97 | 0,12 | 0,35 | 0,36 | 0,2 |
| 01/05/2024 | 1,18 | 5,37 | 0,27 | 39,99 | 0,12 | 0,35 | 0,43 | 0,2 |
| 30/04/2024 | 1,17 | 4,28 | 0,27 | 40,31 | 0,12 | 0,35 | 0,46 | 0,2 |
| 29/04/2024 | 1,19 | 5,24 | 0,27 | 39,6 | 0,12 | 0,35 | 0,45 | 0,2 |
| 28/04/2024 | 1,2 | 5,5 | 0,27 | 40,54 | 0,12 | 0,35 | 0,38 | 0,2 |
| 27/04/2024 | 1,21 | 5,27 | 0,27 | 41,38 | 0,12 | 0,35 | 0,4 | 0,2 |
| 26/04/2024 | 1,24 | 5,15 | 0,27 | 39,93 | 0,12 | 0,35 | 0,46 | 0,2 |
| 25/04/2024 | 1,21 | 5,23 | 0,27 | 40,41 | 0,12 | 0,35 | 0,42 | 0,2 |
Select the year
Periodic self-checks for micropollutants - Year 2022
| TIPO EMISSIONE | Linea 1 | limiti aia | Limiti 152/06 |
| Cd+Tl (mg/Nm3) | 0,00095 | 0,02 | 0,05 |
| Hg (mg/Nm3) | 0,00029 | 0,05 | 0,05 |
| Metalli (mg/Nm3) | 0,01106 | 0,3 | 0,5 |
| Diossine (ng/Nm3) | 0,00077 | 0,05 | 0,1 |
| IPA (mg/Nm3) | 0,000004 | 0,01 | 0,01 |
| PCB (ng/Nm3) | 0,000217 | 0,08 | 0,1 |
Select the year