
-
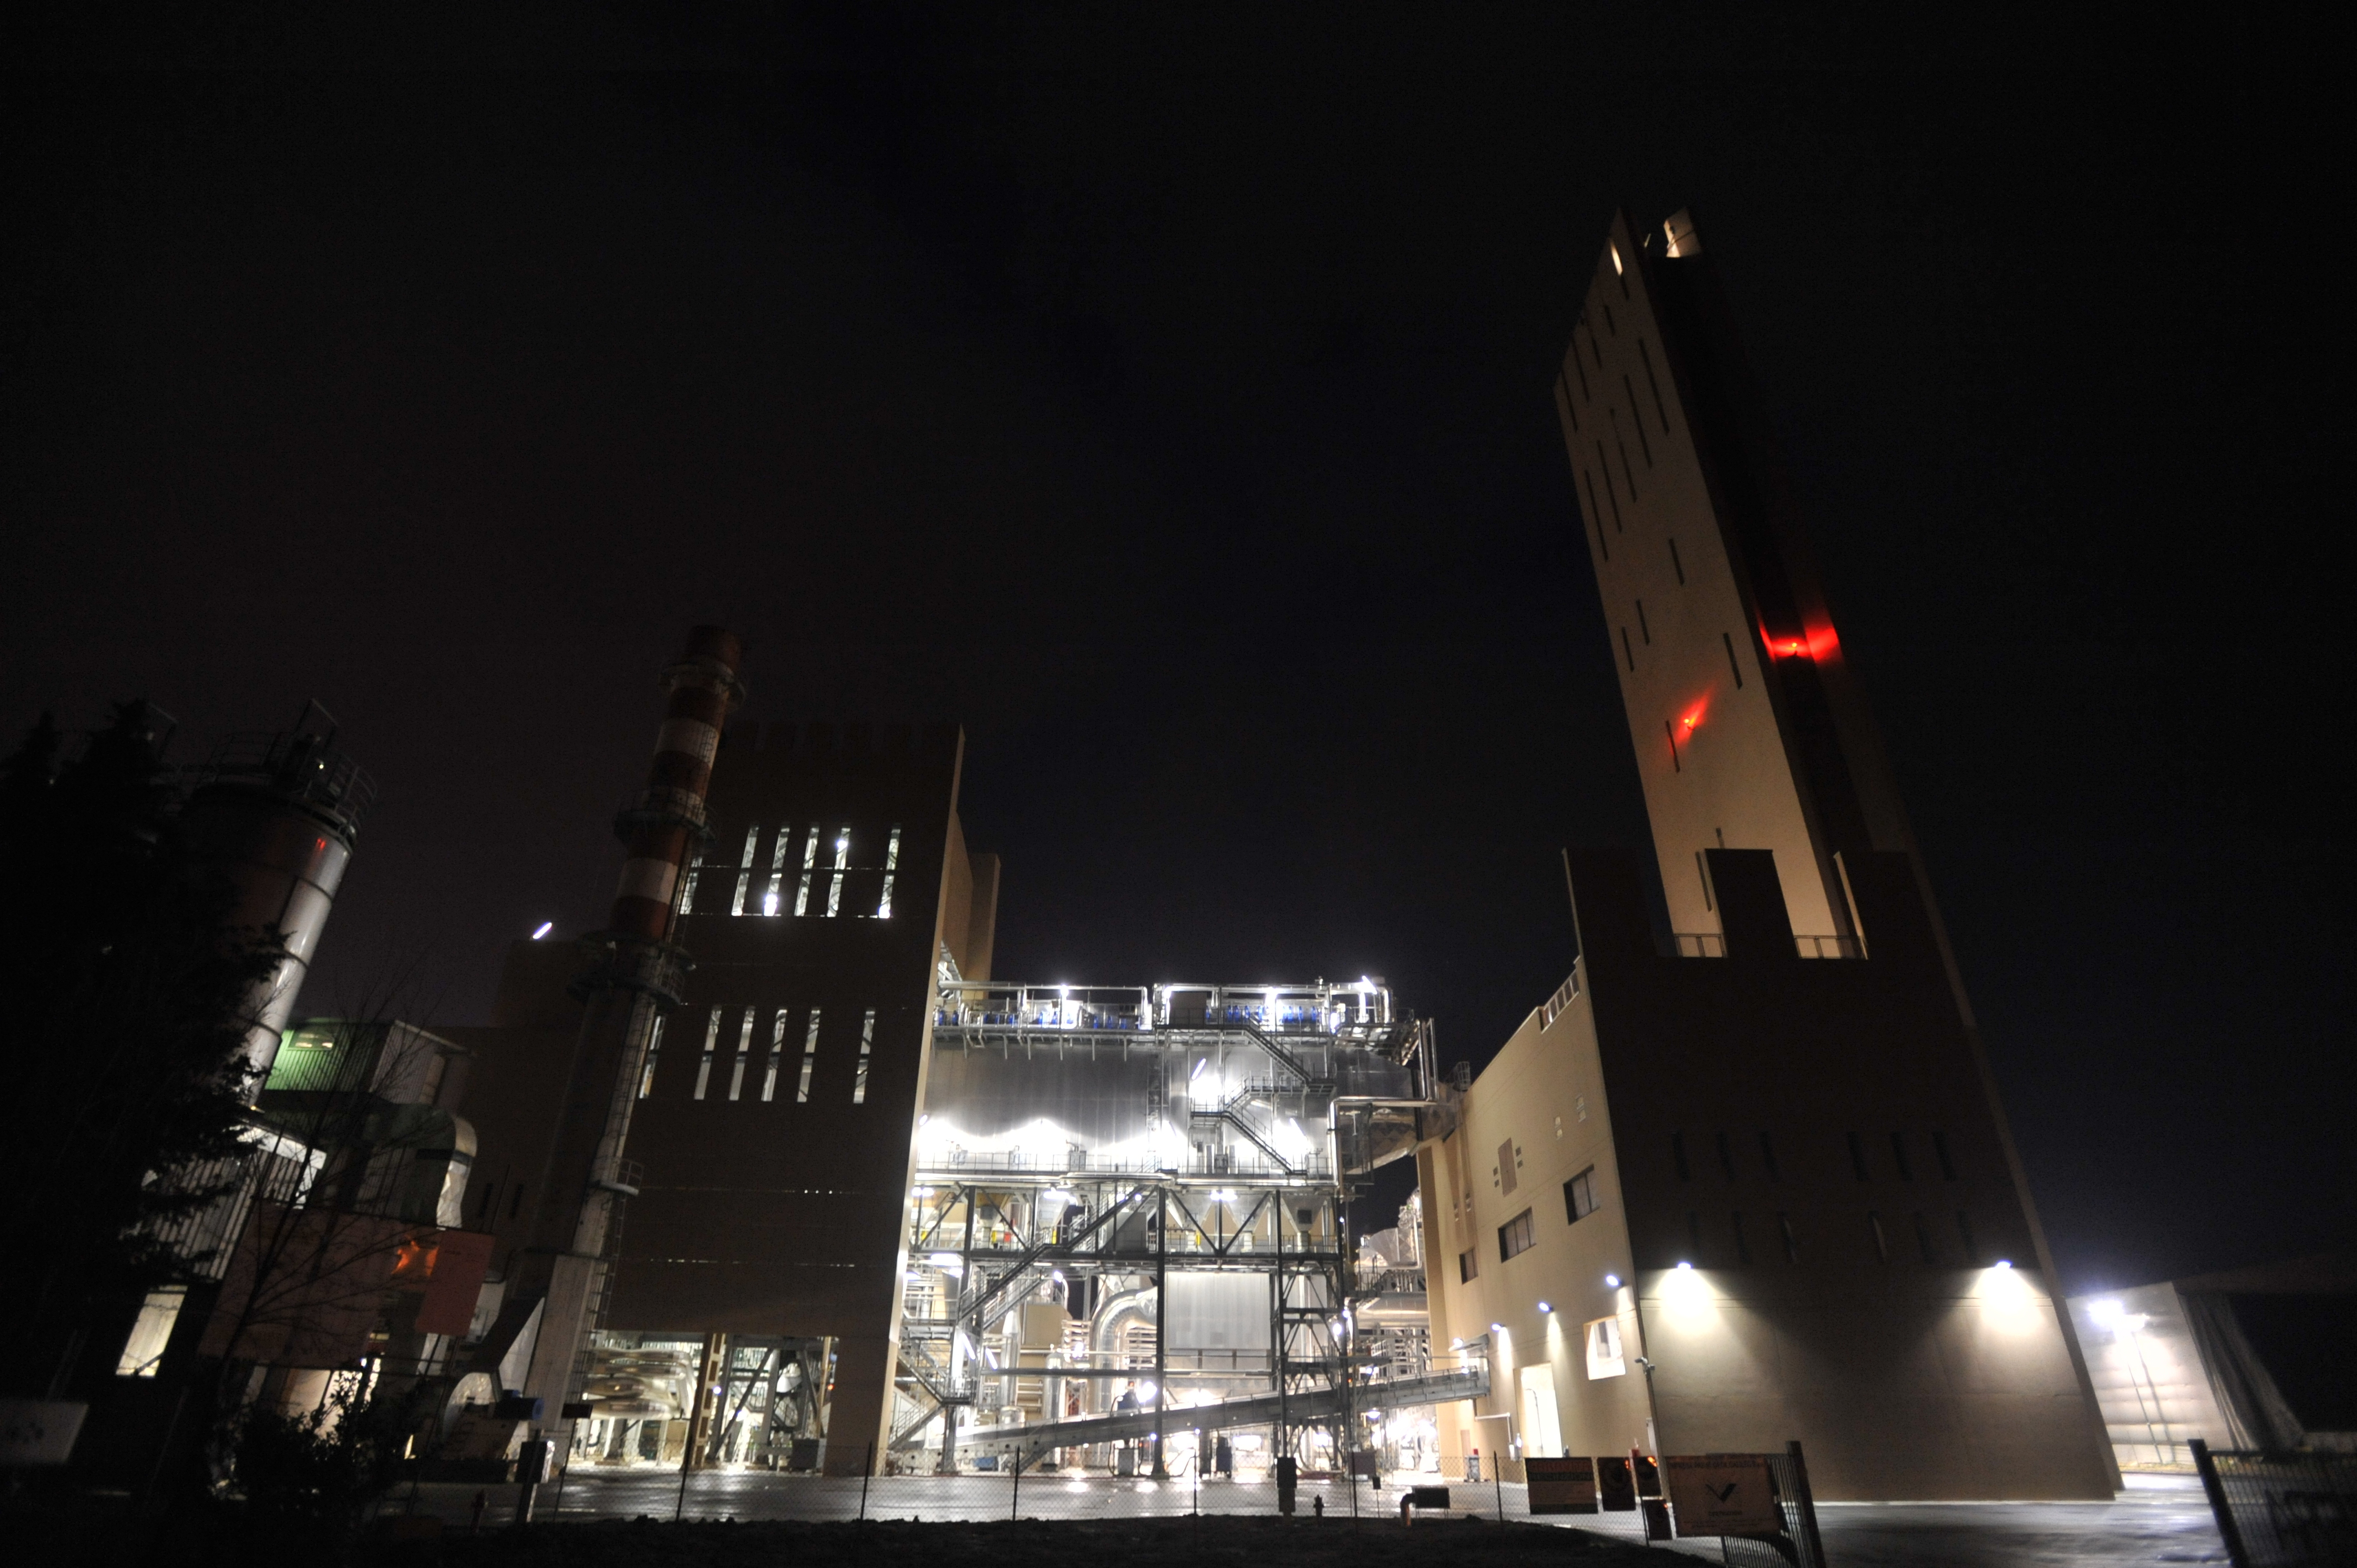
Waste-to-energy plant in Rimini
Via Raibano 32, Coriano (RN)
Waste-to-energy plant
Municipal waste, non-hazardous special waste, medical waste
-
Waste-to-energy plant in Rimini
Via Raibano 32, Coriano (RN)
-
Waste-to-energy plant in Rimini
Via Raibano 32, Coriano (RN)
-
Waste-to-energy plant in Rimini
Via Raibano 32, Coriano (RN)
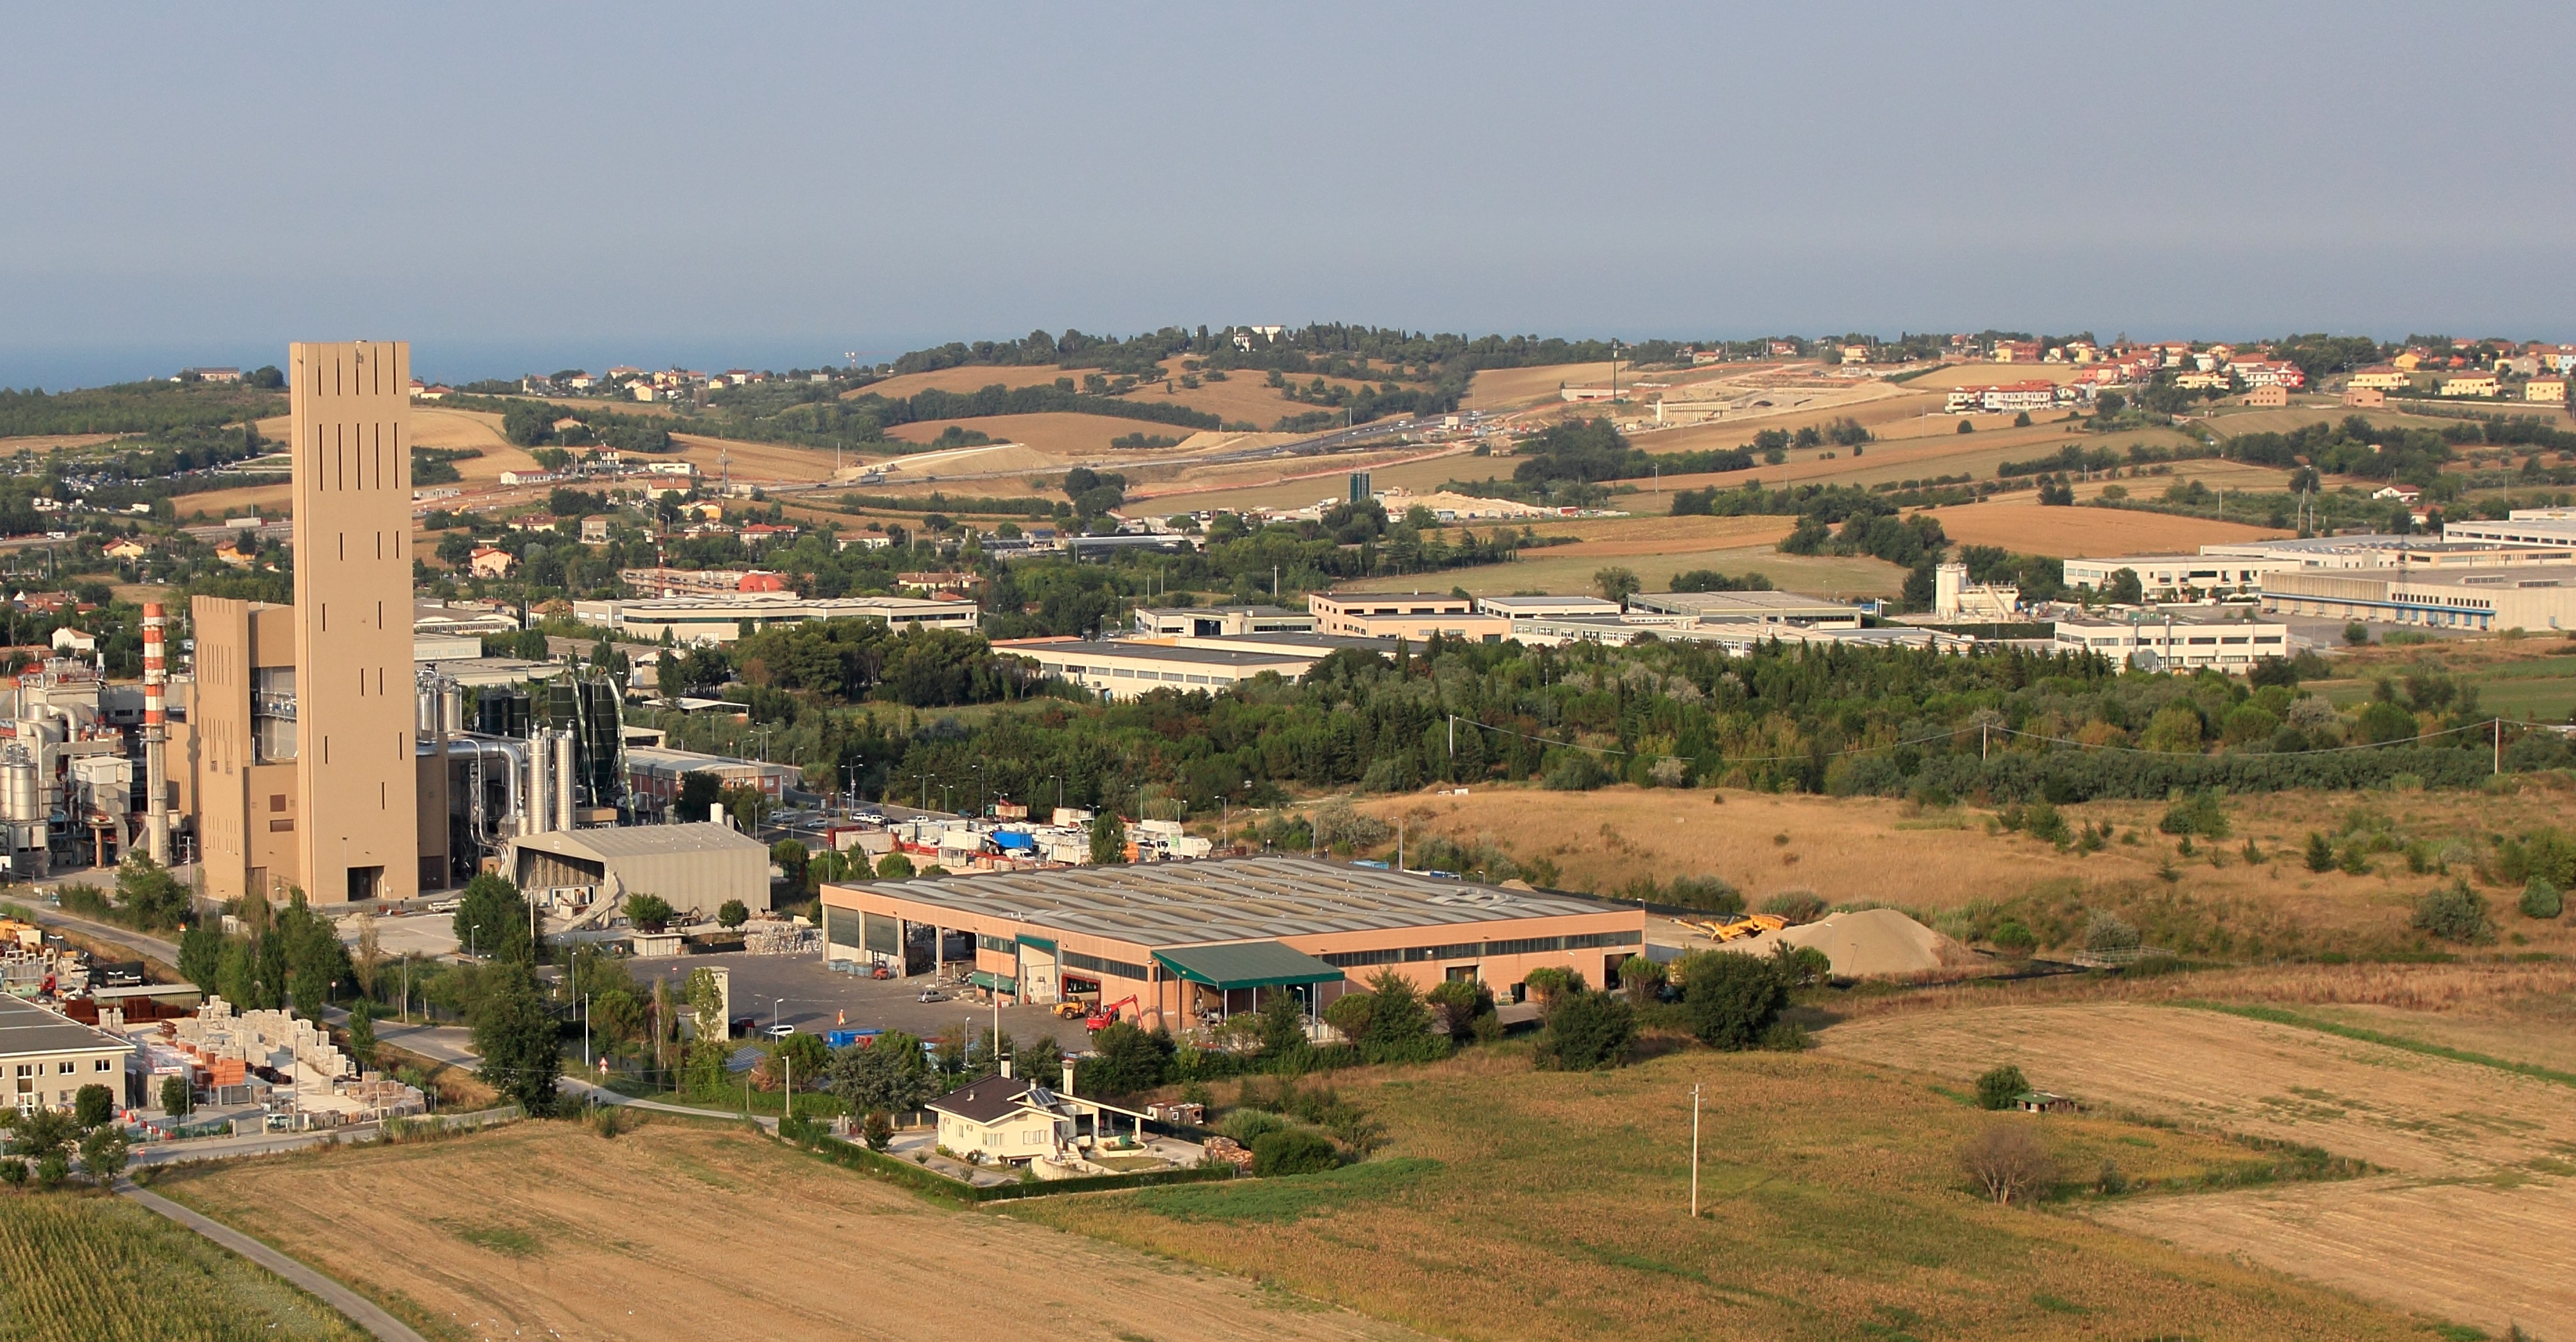
Overview
The Rimini waste to energy plant has been operating since 1976, and began with two incineration lines, to then increase to three incineration lines in the definitive configuration in 1991, equipped with an energy recovery system.
The plant remained unchanged until 2008, when the old lines 1 and 2 were dismantled, and construction of the new line 4 began, which came into operation halfway through 2010.
During the transitional phase, only line 3 remained in operation, then stopped in the second half of 2010.
In addition to the waste energy recovery activity (R1), the Rimini waste to energy plant is also authorised for R12 and R13 recovery operations which, if necessary, allow the waste to be removed from the storage pit. For these activities, the total maximum quantity of waste sent to other destinations, including outside the province, is 30,000 tonnes per year. The maximum quantity of waste authorised for incineration is 150,000 tonnes per year.
Page update 3 June 2021
Form
Environmental compatibility in compliance with regulations in force (Legislative Decree 152/06)
-
Number of waste to energy lines
1 -
Total thermal capacity
about 46.5 MWt -
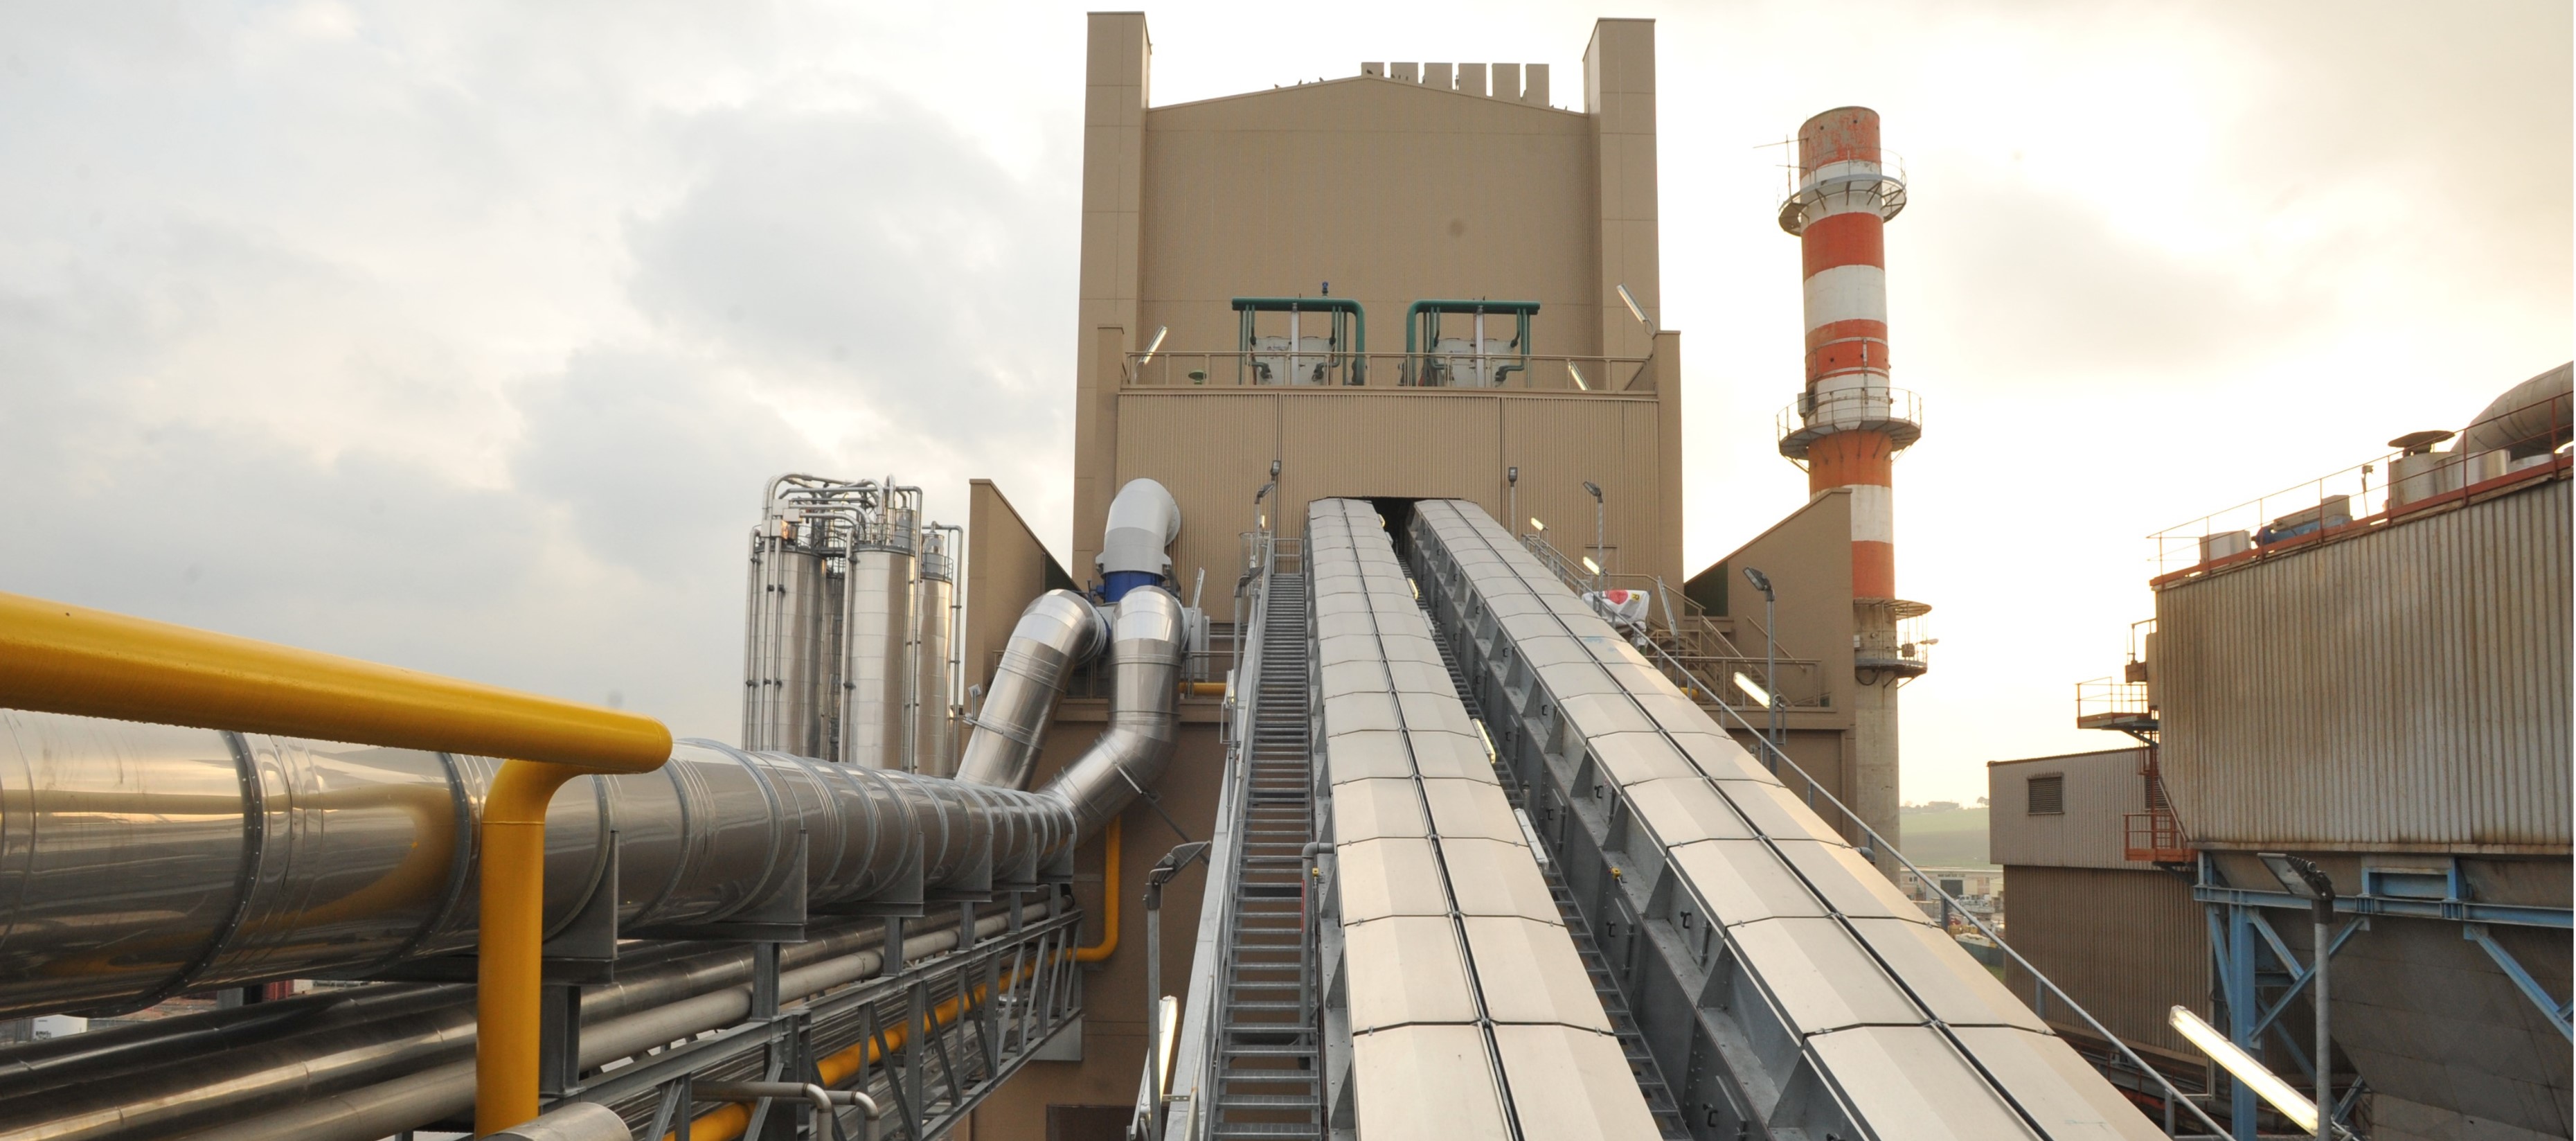
Combustion technology
water cooled moving grate furnaces -
Waste disposal capacity
max 384 t/day with net calorific value (NCV) equal to 10,465 kJ/kg -
Annual operation
7.920 hours -
Nominal electric power
10,5 MWe -
Recovery operations
R1, R12 e R13 -
Type of waste accepted
municipal waste; non hazardous special waste; medical waste

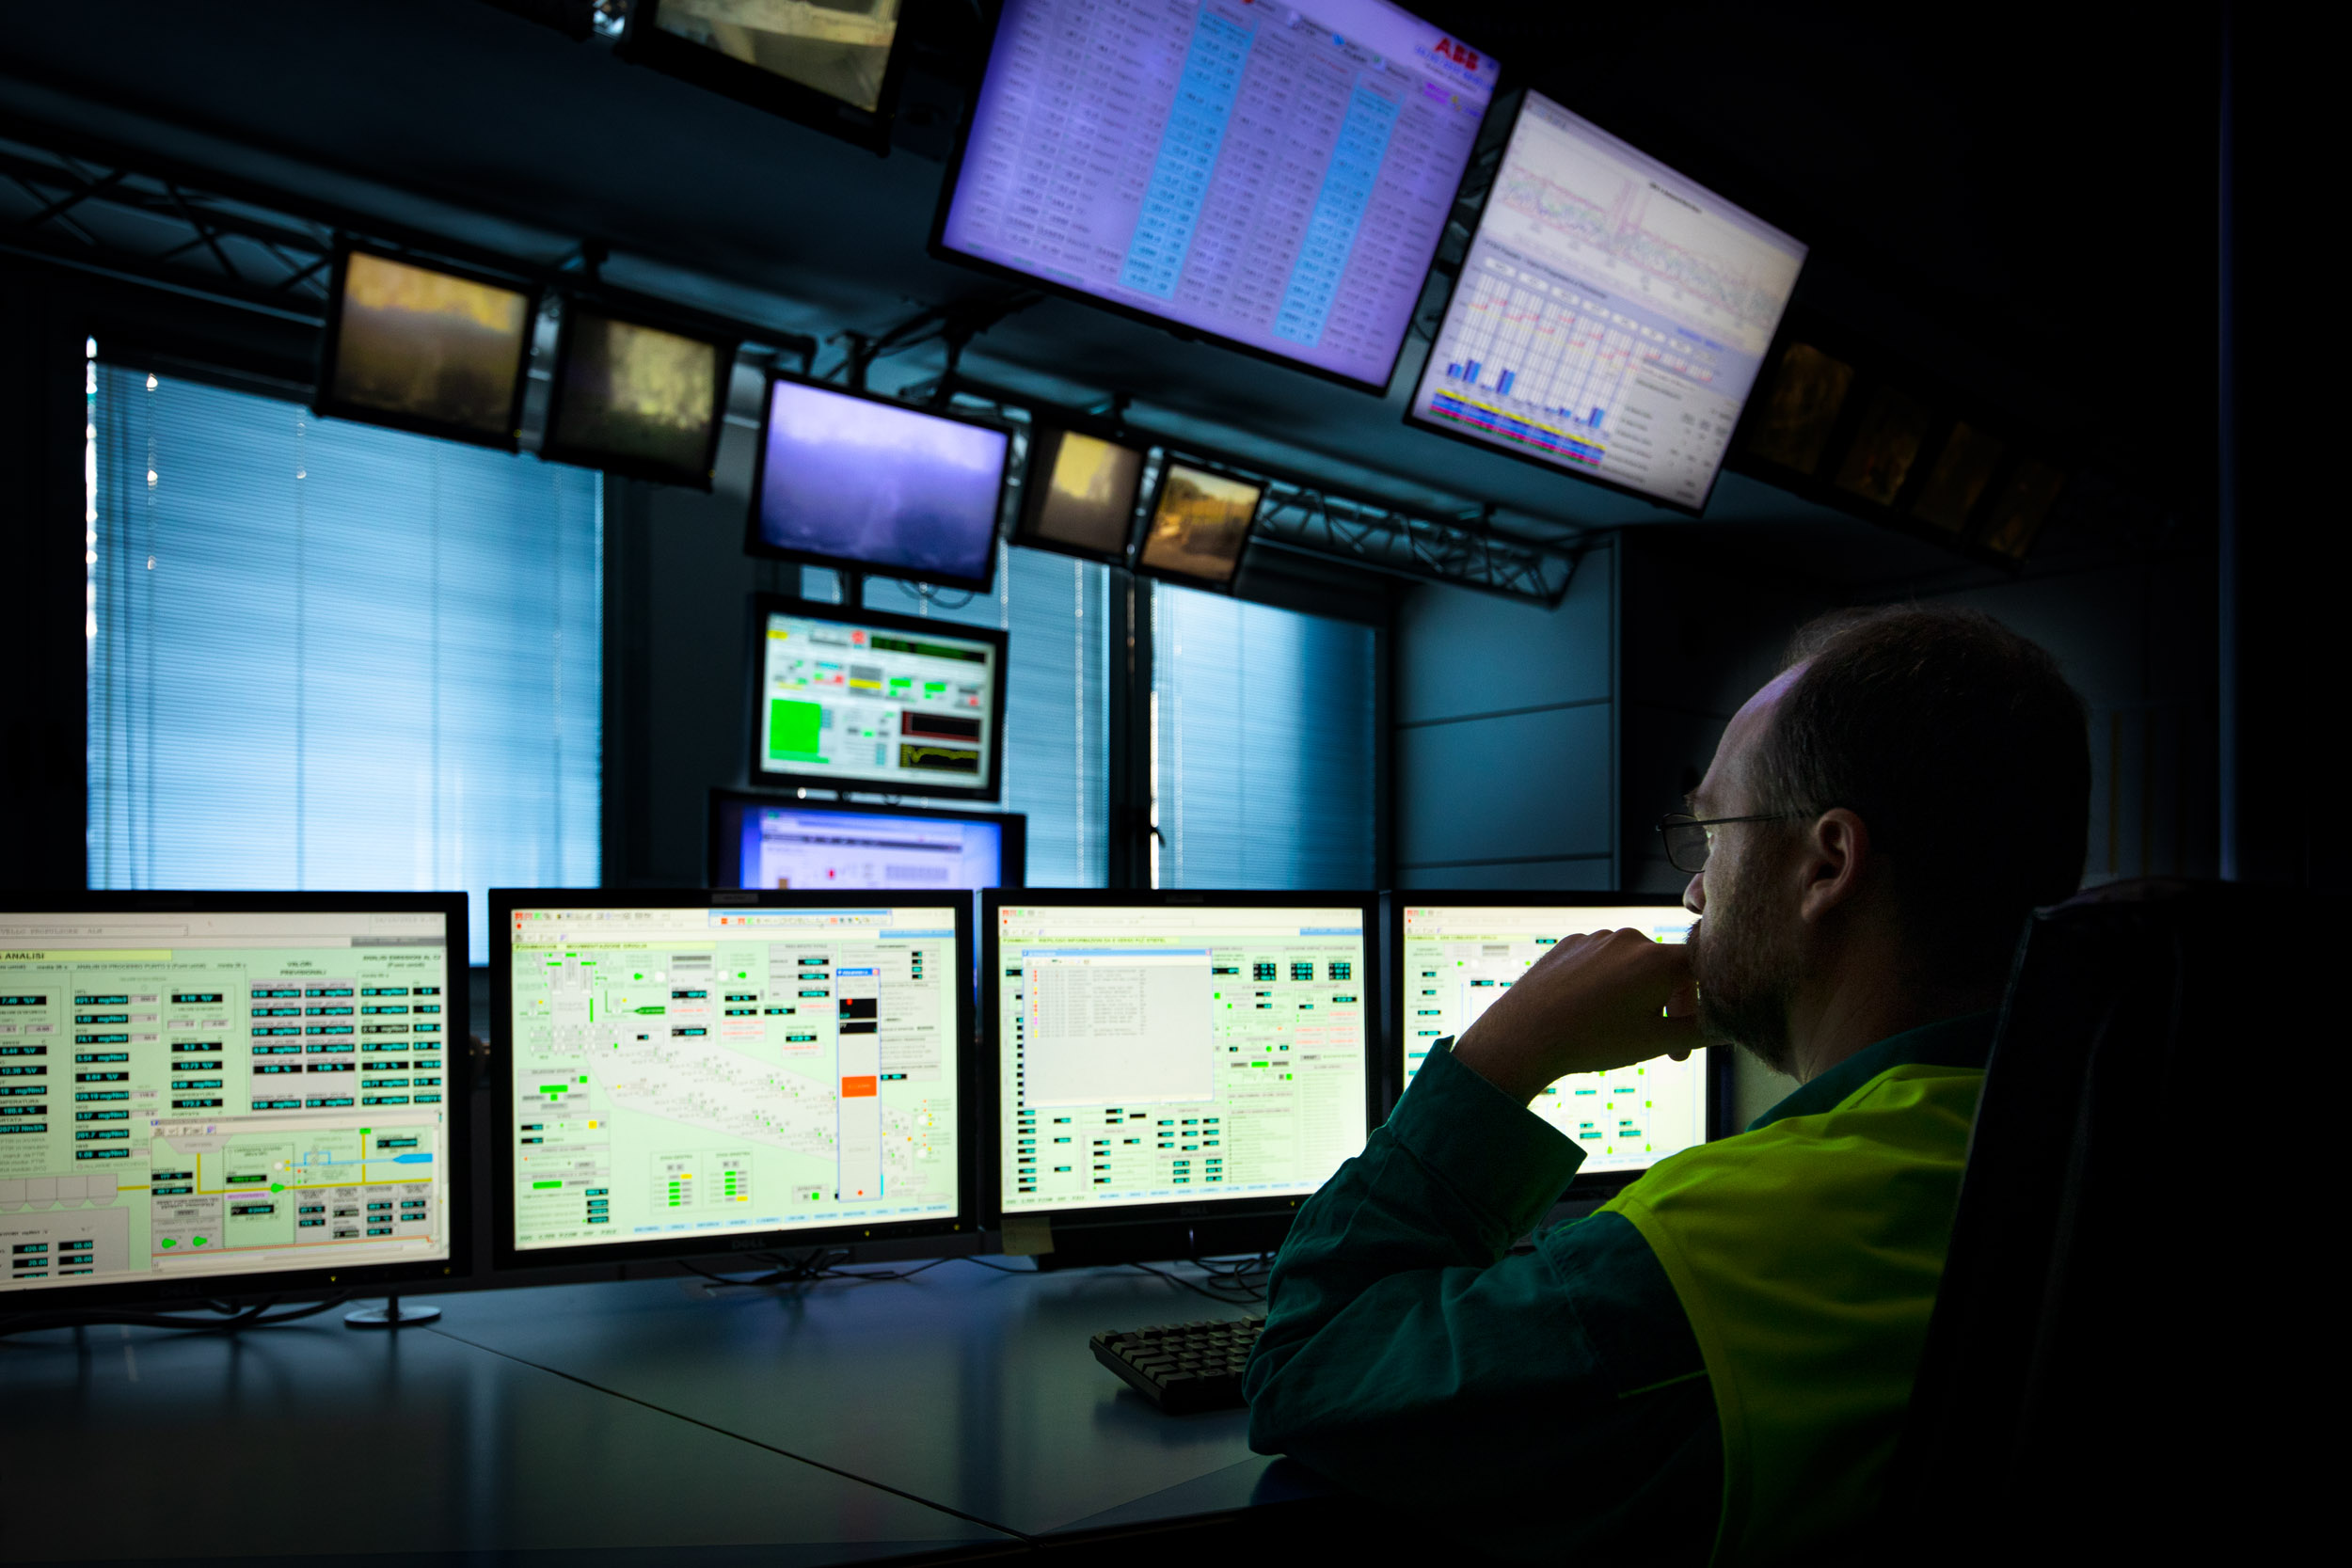
The plant is equipped with a Continuous Emissions Monitoring System (CEMS) which has automatic analysers functioning 24 hours per day to continuously monitor the quality of atmospheric emissions. A suitably heated sample probe continuously transports a sample of the gas from the plant´s chimney to the analysis booth where the instrumentation is installed. The sample is put into the Fourier transform infrared spectroscopy (FTIR) analyser, which continuously detects the absorption spectra of the compounds to be measured. A mathematical process is used to compare the spectra with the typical spectra of the substances being investigated. The comparison makes it possible to determine the quantitative values (concentrations) of the elements and compounds analysed. Besides the FTIR system, there are other continuous analysers and meters needed to complete the fume analysis by determining other parameters such as: particles, organic compounds, mercury, oxygen, temperature, flow and pressure. A data acquisition system (SADE) also continuously provides the values obtained by calculating the half-hourly and daily averages of the concentrations measured, which are compared with the maximum admissible limit values set by the Control Bodies. These data are also provided on the group´s website, where they are automatically updated every half hour.
Emissions report average values of the last half hour
| Type of emission | Average values | Status | ||
| 1,25 | 60 | 60 | OK | |
| 0 | 200 | 200 | OK | |
| 112,9 | 400 | 400 | OK | |
| 0 | 4 | 4 | OK | |
| 0,05 | 30 | 30 | OK | |
| 1,19 | 20 | 20 | OK |
Emissions report average daily values
| 10 | 50 | 50 | 200 | 1 | 10 | 10 | |||||||||||||||||||||||||||||||||||||||||||||||||||||||||||||||||||||||||||||||||||||||||||||
| 10 | 50 | 50 | 200 | 1 | 10 | 10 | |||||||||||||||||||||||||||||||||||||||||||||||||||||||||||||||||||||||||||||||||||||||||||||
| 26/04/2024 | 2,41 | 11,14 | 1,98 | 63,5 | 0,12 | 0,1 | 1,33 | ||||||||||||||||||||||||||||||||||||||||||||||||||||||||||||||||||||||||||||||||||||||||||||
| 25/04/2024 | 2,01 | 7,81 | 2,17 | 73,21 | 0,12 | 0,1 | 1,38 | ||||||||||||||||||||||||||||||||||||||||||||||||||||||||||||||||||||||||||||||||||||||||||||
| 24/04/2024 | 2,24 | 8,7 | 3,65 | 66,99 | 0,12 | 0,1 | 1,27 | ||||||||||||||||||||||||||||||||||||||||||||||||||||||||||||||||||||||||||||||||||||||||||||
| 22/04/2024 | 2,55 | 13,12 | 1,98 | 60,39 | 0,12 | 0,1 | 1,25 | ||||||||||||||||||||||||||||||||||||||||||||||||||||||||||||||||||||||||||||||||||||||||||||
| 21/04/2024 | 2,12 | 12,62 | 1,67 | 59,69 | 0,12 | 0,1 | 1,17 | ||||||||||||||||||||||||||||||||||||||||||||||||||||||||||||||||||||||||||||||||||||||||||||
| 20/04/2024 | 2,34 | 13,48 | 1,6 | 62,82 | 0,12 | 0,1 | 1,23 | ||||||||||||||||||||||||||||||||||||||||||||||||||||||||||||||||||||||||||||||||||||||||||||
| 19/04/2024 | Impianto in avviamento o fermata | ||||||||||||||||||||||||||||||||||||||||||||||||||||||||||||||||||||||||||||||||||||||||||||||||||
| 18/04/2024 | 2,25 | 15,28 | 1,76 | 67,53 | 0,12 | 0,1 | 1,18 | ||||||||||||||||||||||||||||||||||||||||||||||||||||||||||||||||||||||||||||||||||||||||||||
| 17/04/2024 | 2,59 | 15,53 | 1,71 | 73,64 | 0,12 | 0,1 | 1,24 | ||||||||||||||||||||||||||||||||||||||||||||||||||||||||||||||||||||||||||||||||||||||||||||
| 16/04/2024 | 2,05 | 18,11 | 1,92 | 57,38 | 0,12 | 0,1 | 1,2 | ||||||||||||||||||||||||||||||||||||||||||||||||||||||||||||||||||||||||||||||||||||||||||||
Select the year
Periodic self-checks for micropollutants - Year 2022
| TIPO EMISSIONE | Linea 4 | limiti aia | Limiti 152/06 |
| Cd+Tl (mg/Nm3) | 0,0013 | 0,05 | 0,05 |
| Hg (mg/Nm3) | 0,0008 | 0,05 | 0,05 |
| Metalli (mg/Nm3) | 0,010 | 0,5 | 0,5 |
| Diossine (ng/Nm3) | 0,00041 | 0,1 | 0,1 |
| IPA (mg/Nm3) | 0,000007 | 0,01 | 0,01 |
| PCB (ng/Nm3) | 0,00039 | 0,1 | 0,1 |
Select the year
Authorizations
Provv. 3117 del 16/06/2023