
Overview
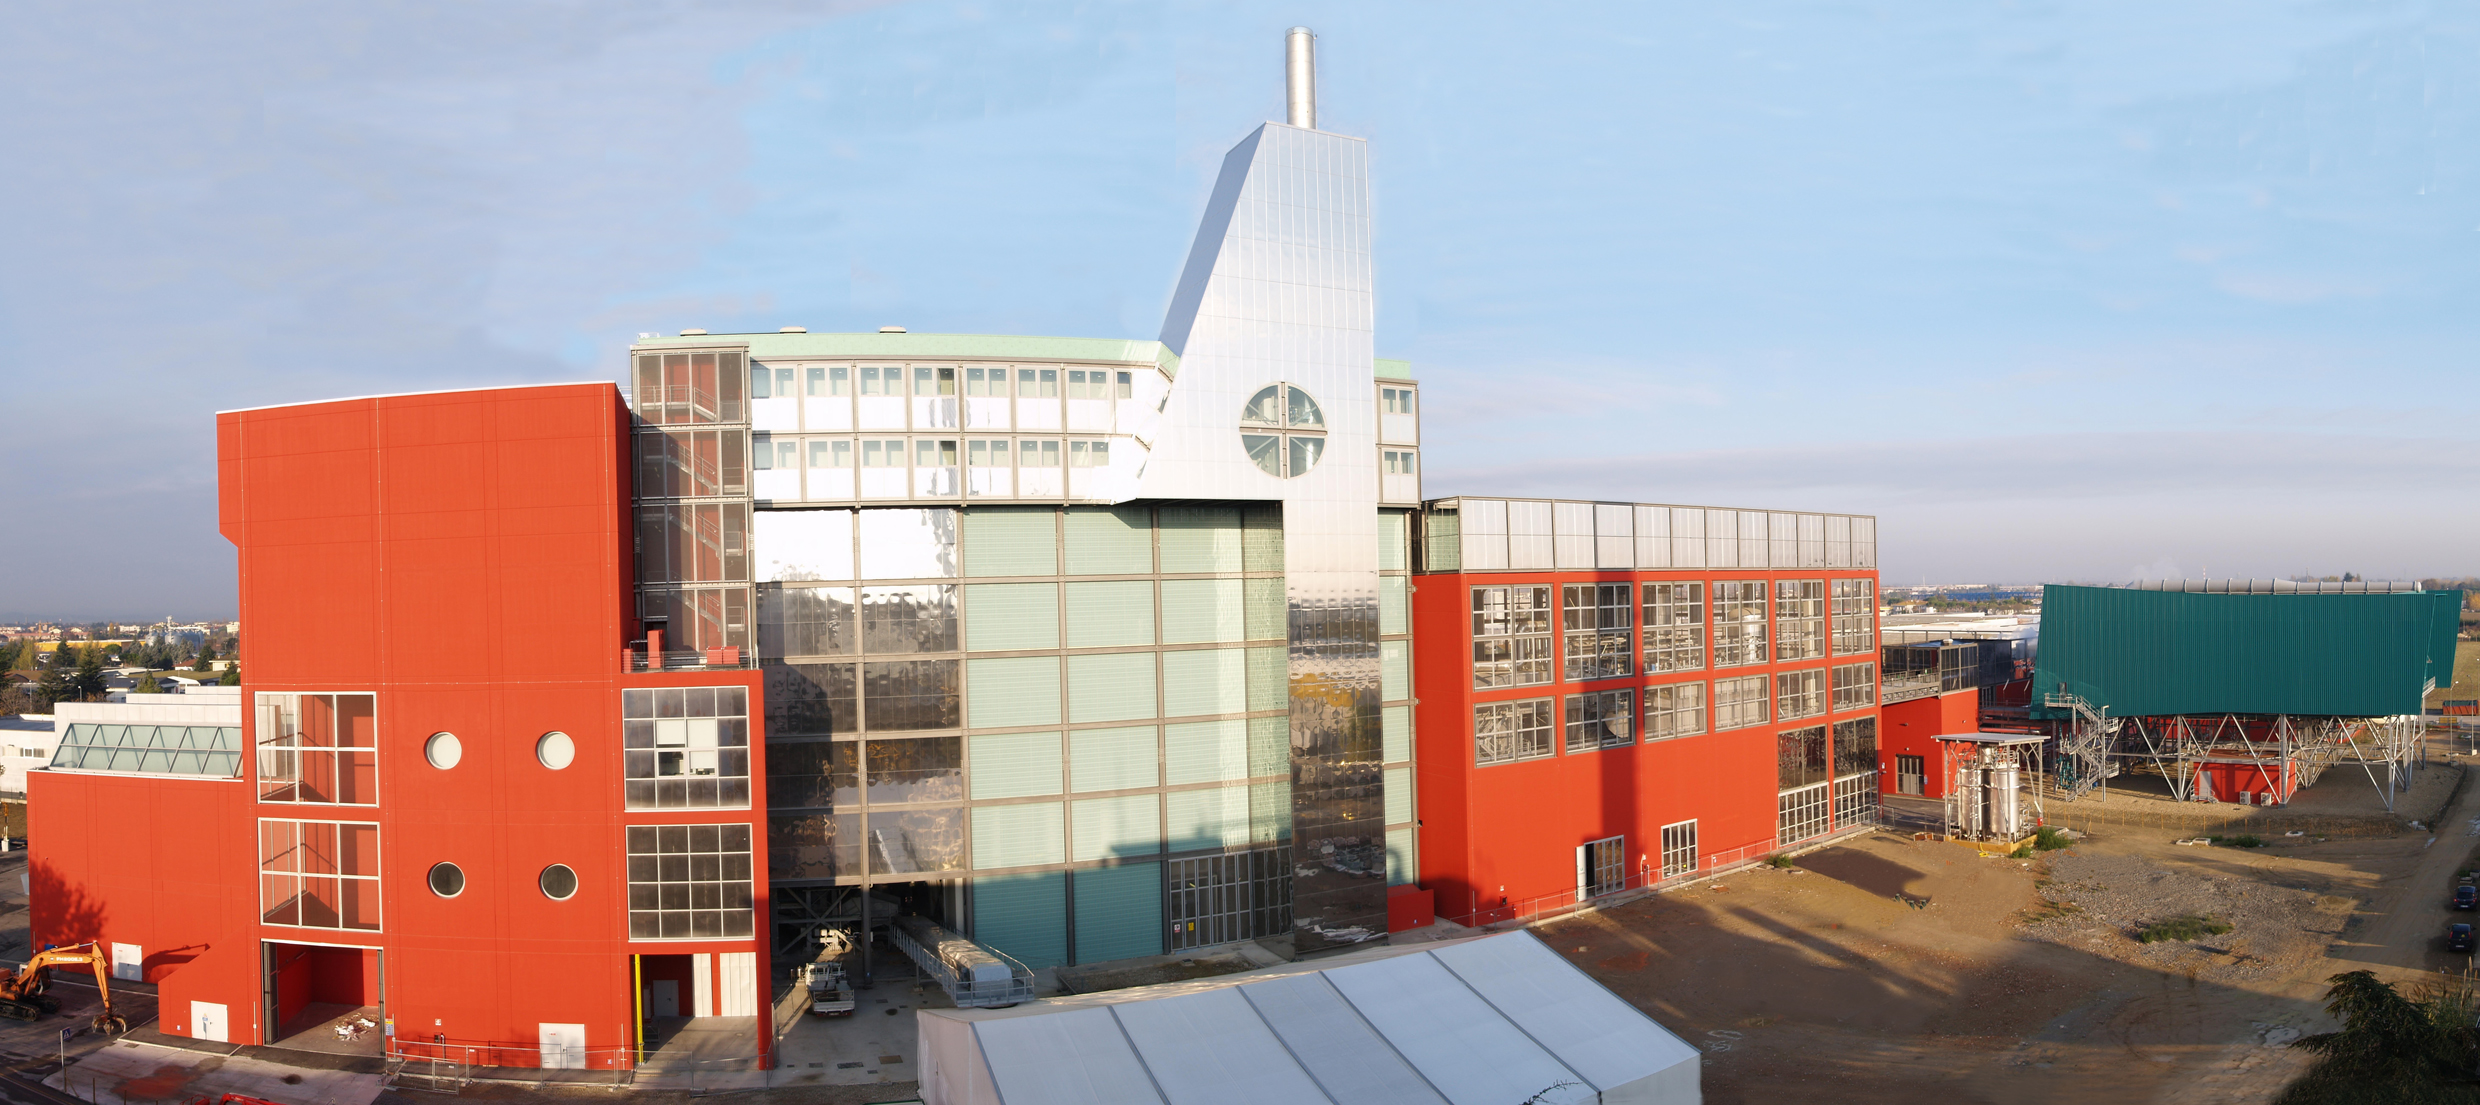
The Forlì waste to energy plant consists of a single incineration line, line 3, started up in August 2008. The decommissioning and demolition operations of the two old lines, 1 and 2, were completed in October 2009.
The construction of line 3 led to an adjustment of the incineration plant's potential from 60,000 to 120,000 tons per year, as envisaged by the Provincial Waste Management Plan.
The Forlì waste to energy plant is an incinerator that uses the heat generated during the combustion of waste, also exploiting the renewable fraction, to reconvert it into electrical and thermal energy.
In the plant complex of Forlì there is also an equipped ecological platform (PEA).
Page updated on June 3, 2021
Form
Environmental compatibility in compliance with current legislation (Legislative Decree 152/06)
-
Number of waste to energy lines
1 -
Total thermal capacity
Approximately 46.5 MWt -
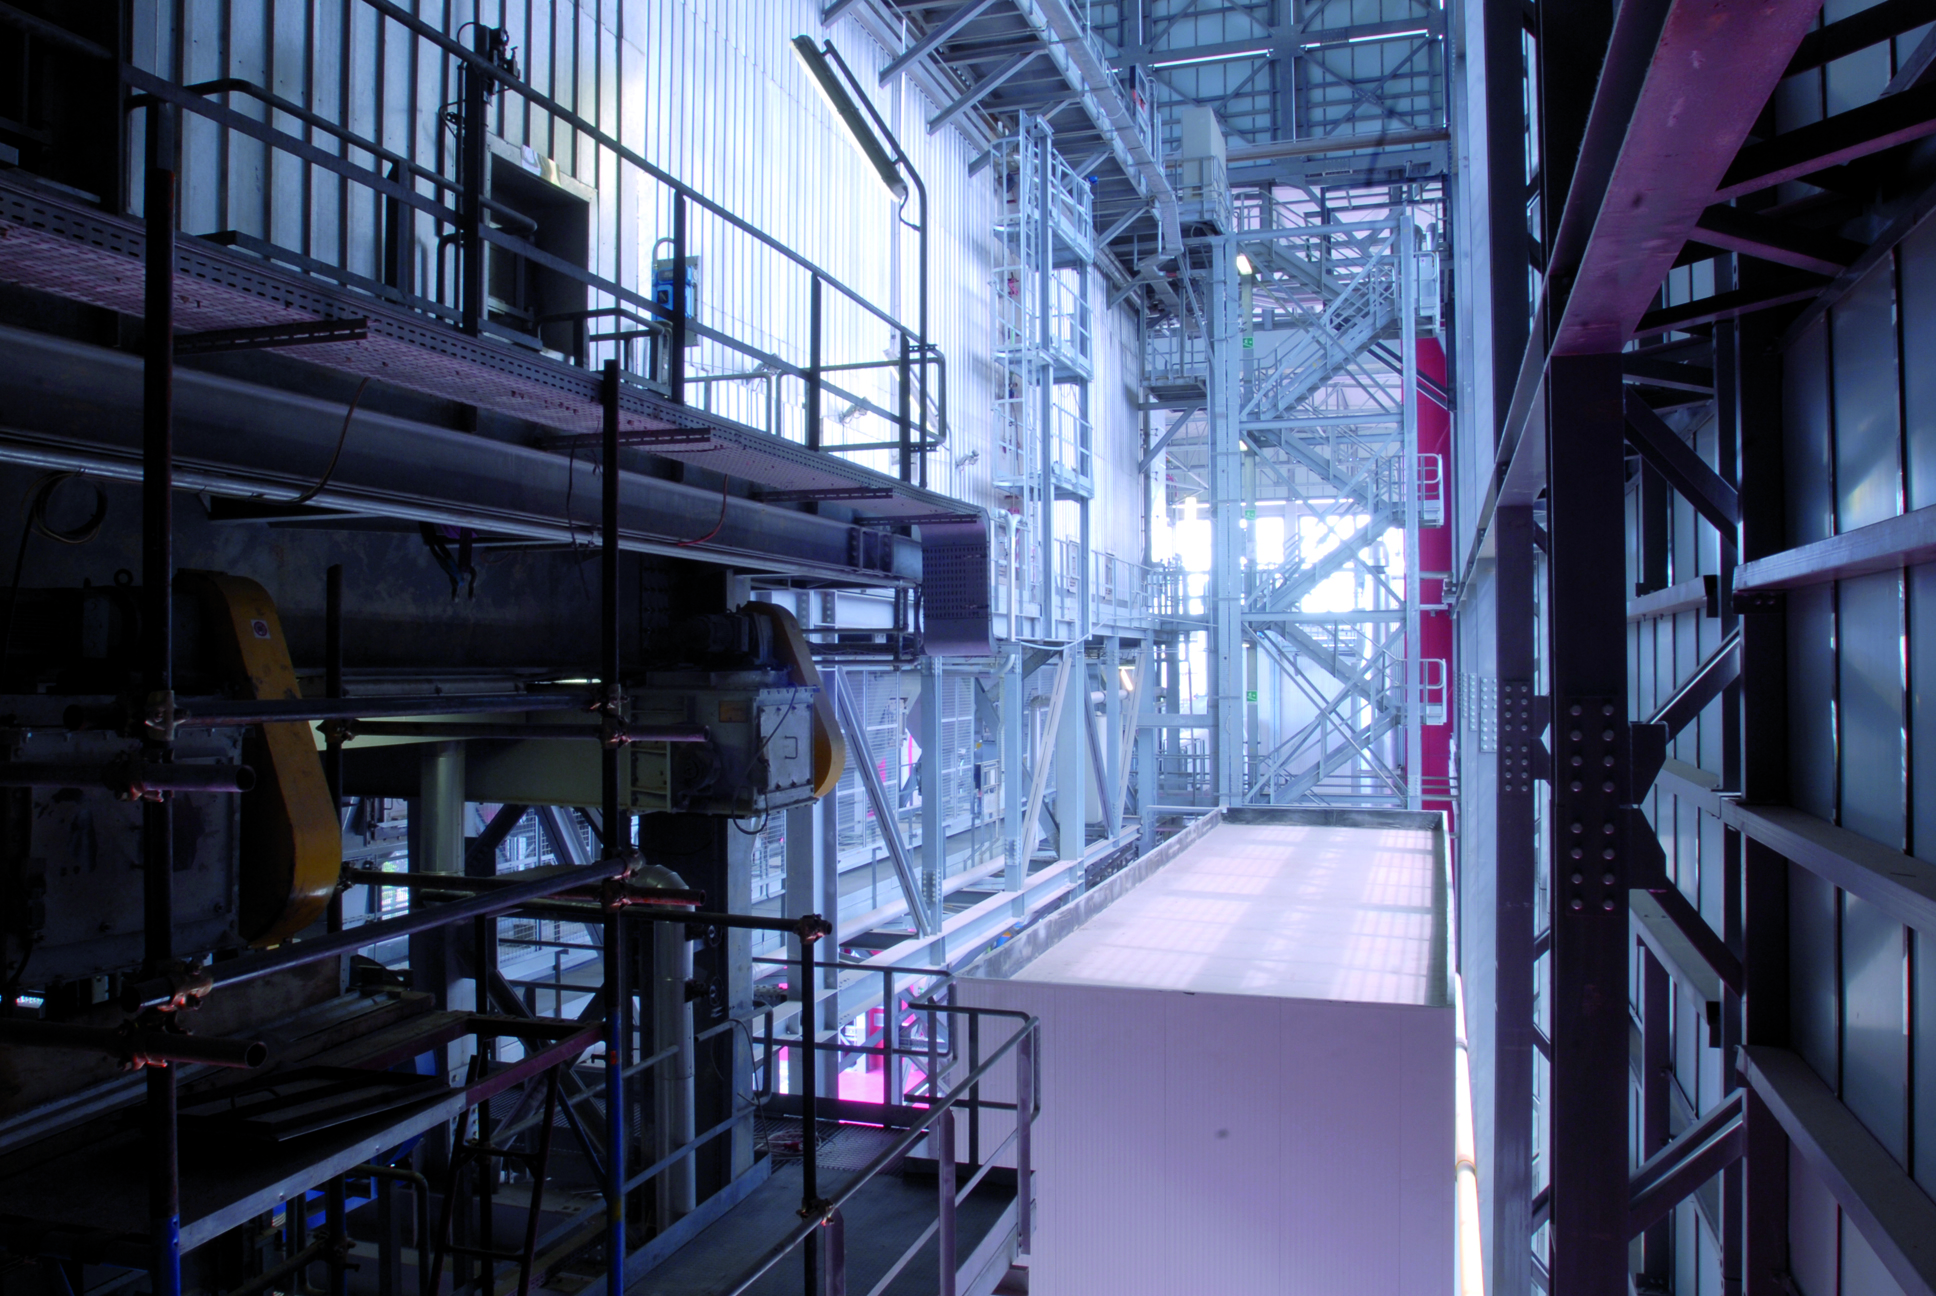
Combustion technology
Water cooled moving grate incinerators -
Waste disposal capacity
Max. 384 tonnes/d with LCV of 10,465 kJ/kg -
Annual operation
7,500 hours -
Rated electric power
10,6 MWe -
Disposal and recovery codes
R1; R12; -
Type of waste accepted
Municipal waste

- injection of urea into the combustion chamber to lower NOx emissions;
- injection of sodium bicarbonate and active carbons upon release of fumes from the economiser to reduce acid (HCl and SO2) and heavy metal emissions;
- final filtration to restrain the particulate matter carried by the fumes before transfer to the chimney stack.
The plant is equipped with a Continuous Emissions Monitoring System (CEMS) which has automatic analysers functioning 24 hours per day to continuously monitor the quality of atmospheric emissions. A suitably heated sample probe continuously transports a sample of the gas from the plant´s chimney to the analysis booth where the instrumentation is installed. The sample is put into the Fourier transform infrared spectroscopy (FTIR) analyser, which continuously detects the absorption spectra of the compounds to be measured. A mathematical process is used to compare the spectra with the typical spectra of the substances being investigated. The comparison makes it possible to determine the quantitative values (concentrations) of the elements and compounds analysed. Besides the FTIR system, there are other continuous analysers and meters needed to complete the fume analysis by determining other parameters such as: particles, organic compounds, mercury, oxygen, temperature, flow and pressure. A data acquisition system (SADE) also continuously provides the values obtained by calculating the half-hourly and daily averages of the concentrations measured, which are compared with the maximum admissible limit values set by the Control Bodies. These data are also provided on the group´s website, where they are automatically updated every half hour.
Emissions report average values of the last half hour
| Type of emission | Average values | Status | ||
| ND | 50 | 60 | ND | |
| ND | 150 | 200 | ND | |
| ND | 300 | 400 | ND | |
| ND | 2 | 4 | ND | |
| ND | 20 | 30 | ND | |
| ND | 20 | 20 | ND | |
| ND | 60 | 60 | ND |
Emissions report average daily values
| 10 | 50 | 50 | 200 | 1 | 10 | 10 | 30 | ||||||||||||||||||||||||||||||||||||||||||||||||||||||||||||||||||||||||||||||||||||||||||||
| 8 | 30 | 10 | 70 | 0,5 | 3 | 5 | 10 | ||||||||||||||||||||||||||||||||||||||||||||||||||||||||||||||||||||||||||||||||||||||||||||
| 03/05/2024 | Impianto in avviamento o fermata | ||||||||||||||||||||||||||||||||||||||||||||||||||||||||||||||||||||||||||||||||||||||||||||||||||
| 02/05/2024 | Impianto fermo | ||||||||||||||||||||||||||||||||||||||||||||||||||||||||||||||||||||||||||||||||||||||||||||||||||
| 01/05/2024 | Impianto fermo | ||||||||||||||||||||||||||||||||||||||||||||||||||||||||||||||||||||||||||||||||||||||||||||||||||
| 30/04/2024 | Impianto in avviamento o fermata | ||||||||||||||||||||||||||||||||||||||||||||||||||||||||||||||||||||||||||||||||||||||||||||||||||
| 29/04/2024 | Impianto in avviamento o fermata | ||||||||||||||||||||||||||||||||||||||||||||||||||||||||||||||||||||||||||||||||||||||||||||||||||
| 28/04/2024 | Impianto fermo | ||||||||||||||||||||||||||||||||||||||||||||||||||||||||||||||||||||||||||||||||||||||||||||||||||
| 27/04/2024 | Impianto fermo | ||||||||||||||||||||||||||||||||||||||||||||||||||||||||||||||||||||||||||||||||||||||||||||||||||
| 26/04/2024 | Impianto in avviamento o fermata | ||||||||||||||||||||||||||||||||||||||||||||||||||||||||||||||||||||||||||||||||||||||||||||||||||
| 25/04/2024 | Impianto fermo | ||||||||||||||||||||||||||||||||||||||||||||||||||||||||||||||||||||||||||||||||||||||||||||||||||
| 24/04/2024 | Impianto fermo | ||||||||||||||||||||||||||||||||||||||||||||||||||||||||||||||||||||||||||||||||||||||||||||||||||
Select the year
Periodic self-checks for micropollutants - Year 2022
| TIPO EMISSIONE | Linea 3 | limiti aia | Limiti 152/06 |
| Cd+Tl (mg/Nm3) | 0,00024 | 0,03 | 0,05 |
| Hg (mg/Nm3) | 0,0005 | 0,03 | 0,05 |
| Metalli (mg/Nm3) | 0,0098 | 0,4 | 0,5 |
| Diossine (ng/Nm3) | 0,00023 | 0,05 | 0,1 |
| IPA (mg/Nm3) | 0,0000029 | 0,005 | 0,01 |
| PCB (ng/Nm3) | 0,00001 | 0,1 | 0,1 |