Overview
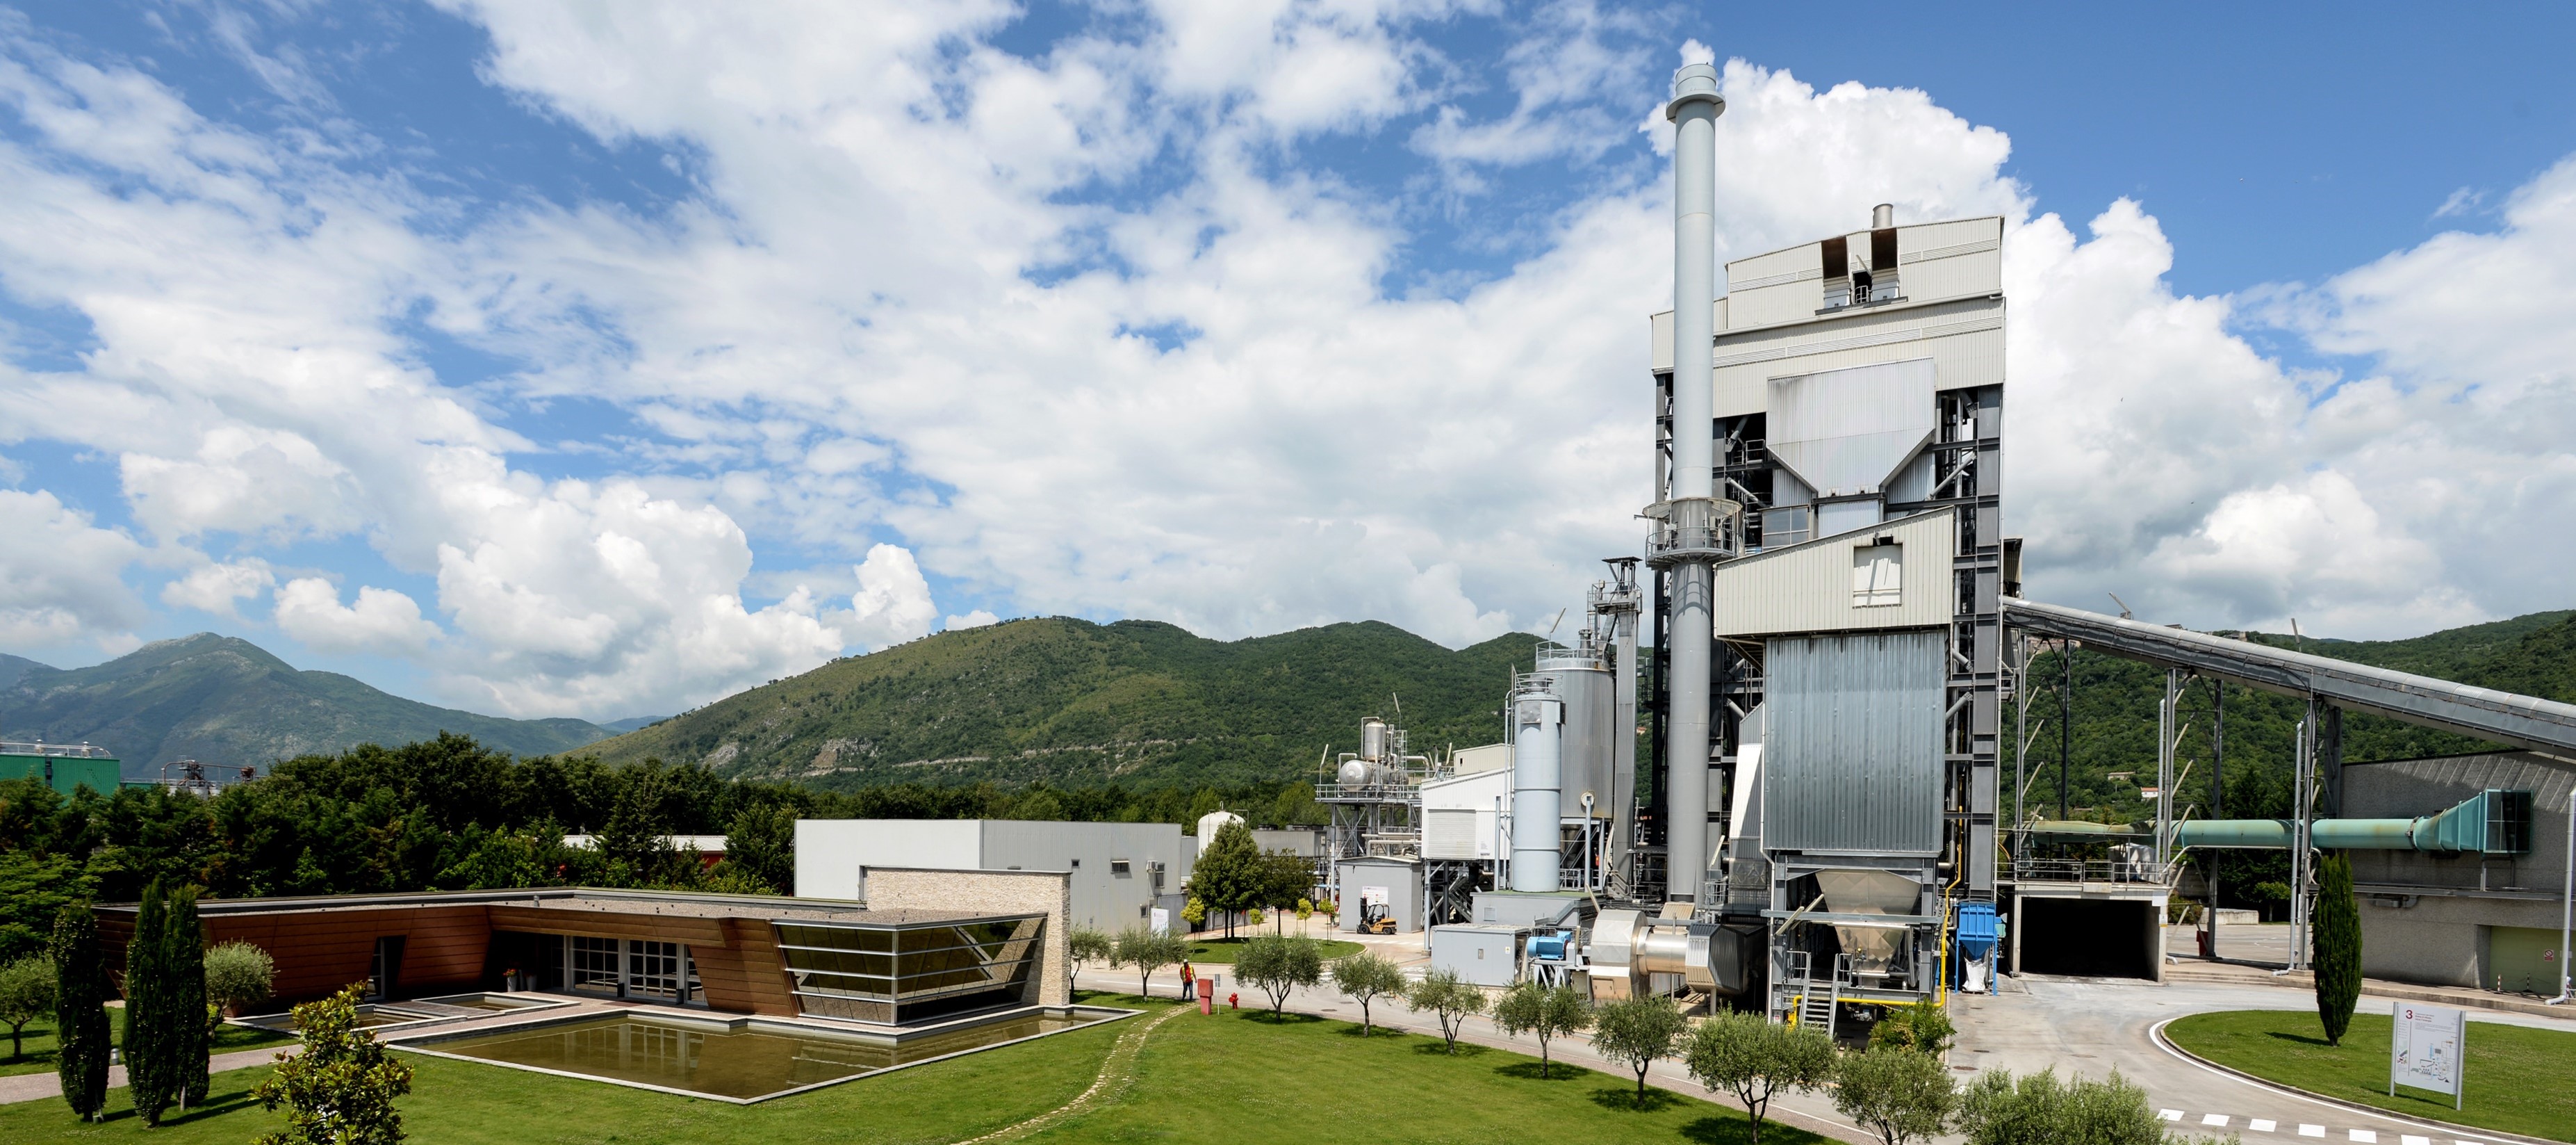
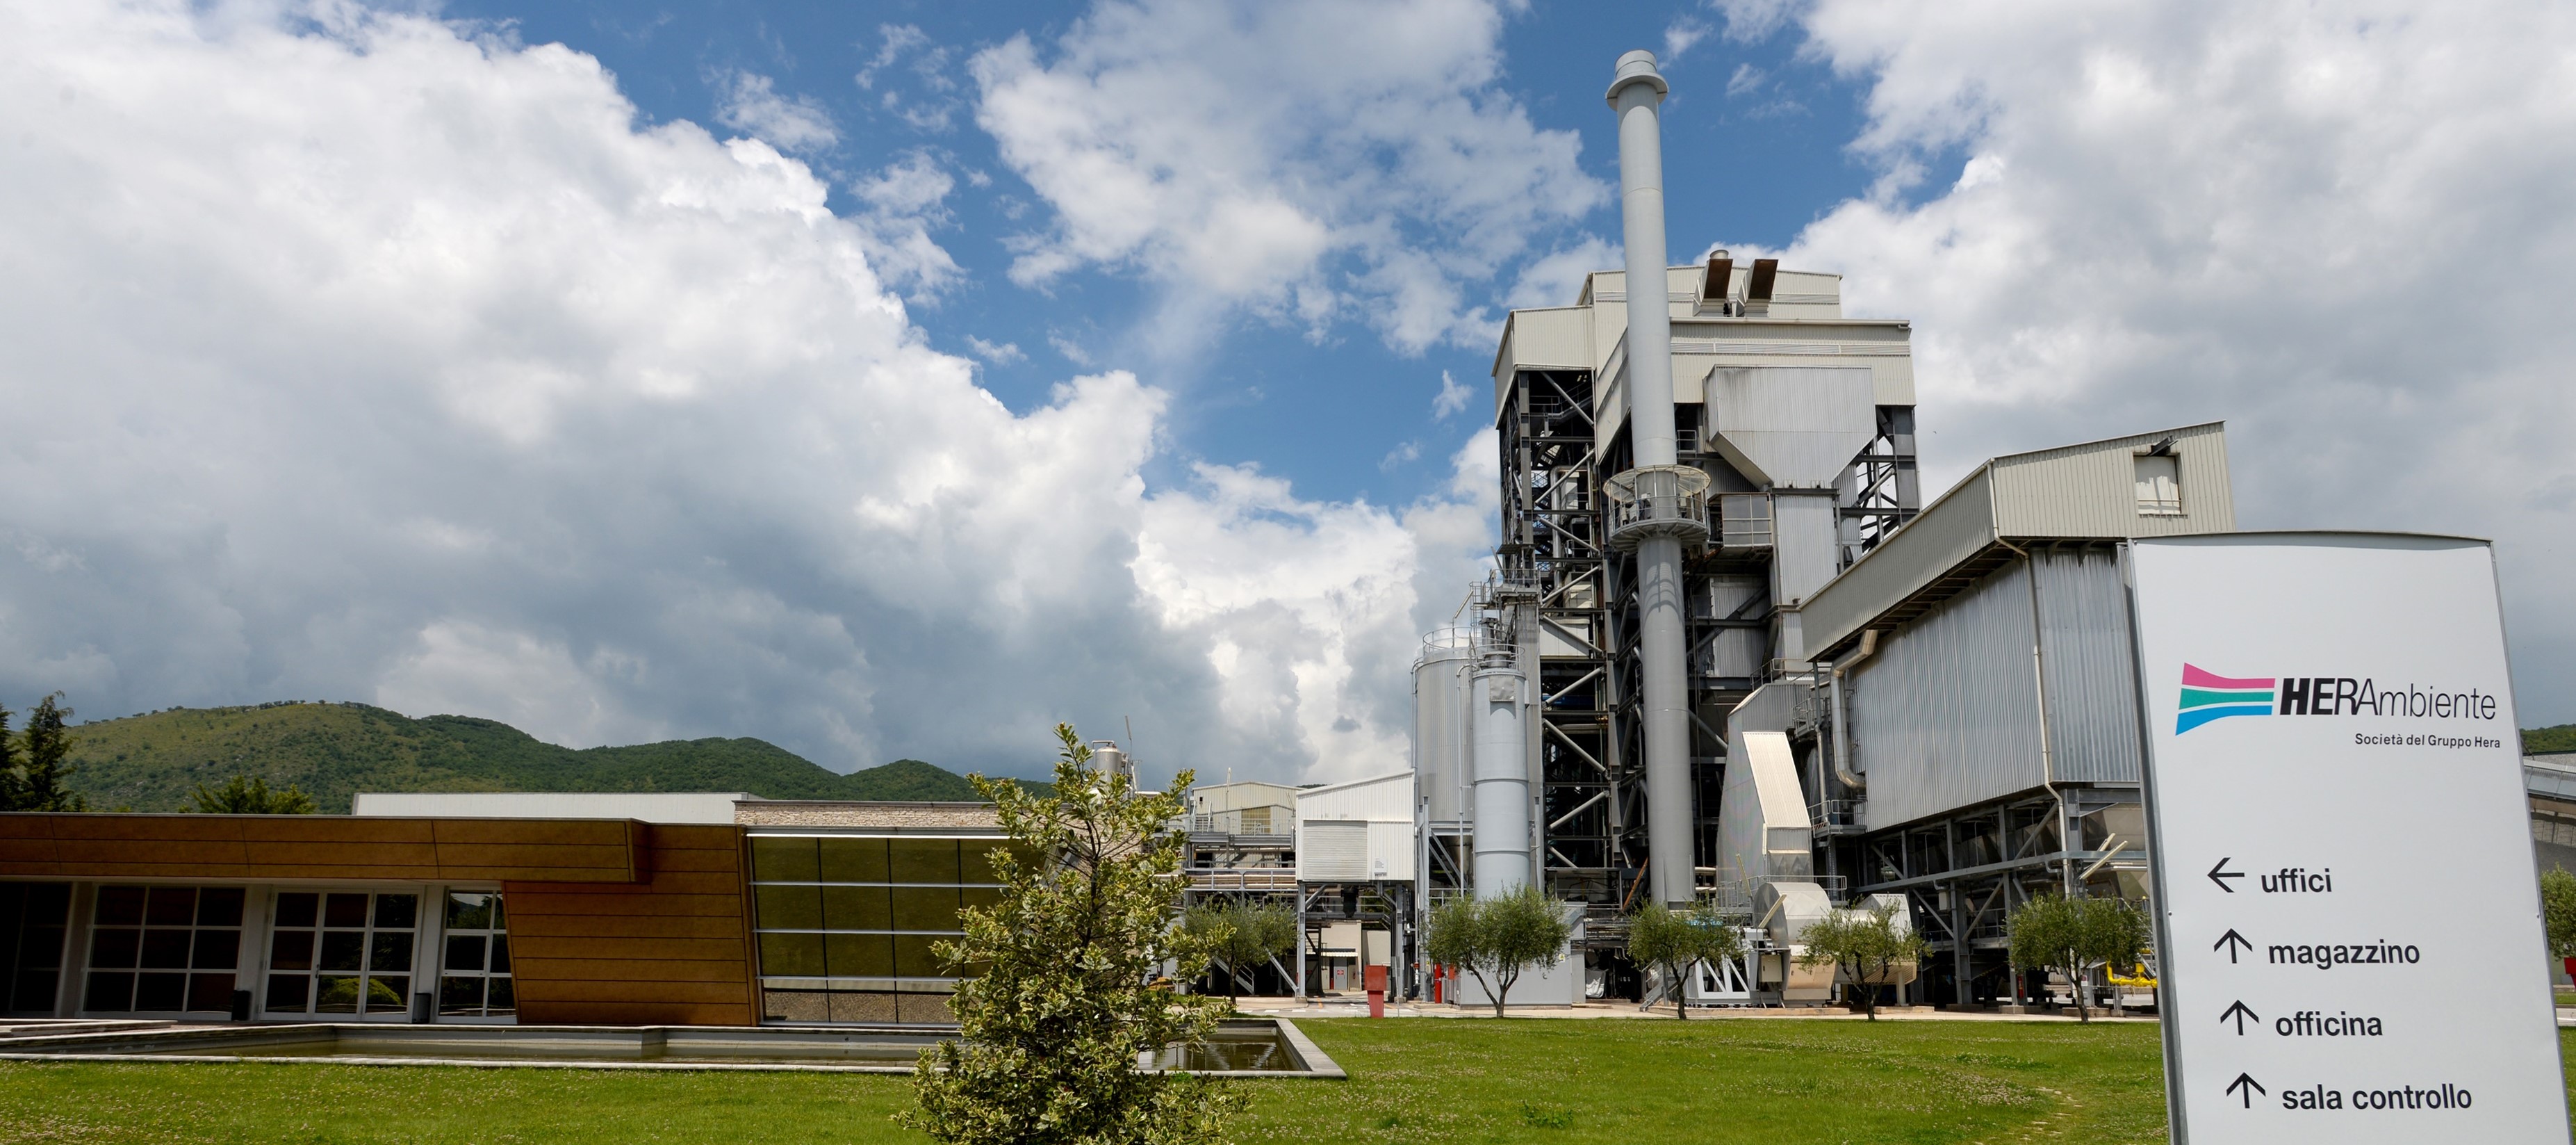
The thermoelectric power plant of Pozzilli is classified as a Plant Powered by Renewable Sources (RES power plant), pursuant to Italian Legislative Decree no. 79 of 16 March 1999 and no. 387 of 29 December 2003, as well as a co incineration plant in accordance with Italian Legislative Decree no. 133 of 11 May 2005, implementing the European Directive 2000/76/EC, specifically relating to the production of electricity.
The current plant is the result of the renovation of the pre existing facility located at the same site and deactivated at the end of 2005 in accordance with the provisions of Decree no. 79 of 16 March 1999, in order to obtain the IAFR classification by the Electricity System Operator (GSE) and including an appropriate improvement of the plant's energy and environmental performance, pursuant to the Ministerial Decree of 11 November 1999.
This renovation implied the replacement of the steam generator boilers and of the turbine alternator condenser unit, requiring a thorough and systematic review of all the design and construction criteria, in light of the most recent operational and environmental regulations, including the provisions of Legislative Decree no. 133 of 11 May 2005.
The maximum authorised capacity is 93,500 tonnes of incoming waste per year.
Page updated 26 August 2015
Forms
Environmental compatibility in compliance with current legislation (Legislative Decree 152/06)
-
Number of lines
1 -
Total thermal capacity
Approximately 47 MWt -
Combustion technology
Martin grate incinerator -
Waste disposal capacity
Max. approximately 280 t/d with LCV of 15,000 kJ/kg -
Annual operation
8.000 hr -
Rated electric power
11,5 MW -
Recovery code
R1 -
Type of waste accepted
WDF waste derived fuel
- injection of urea into the combustion chamber to lower NOx emissions;
- injection of sodium bicarbonate and active carbons upon release of fumes from the economiser to reduce acid (HCl and SO2) and heavy metal emissions;
- final filtration to restrain the particulate matter carried by the fumes before transfer to the chimney stack.
The plant is equipped with a Continuous Emissions Monitoring System which has automatic analysers functioning 24 hours per day to monitor the quality of atmospheric emissions from one moment to the next. A suitably heated sample probe continuously transports a sample of the gas from the plant´s chimney to the analysis booth where the instrumentation is installed. The sample is put into the Fourier transform infrared spectroscopy (FTIR) analyser, which continuously detects the absorption spectra of the compounds to be measured. A mathematical process is used to compare the spectra with the stored typical spectra of the substances being investigated. The comparison makes it possible to determine the quantitative values (concentrations) of the elements and compounds analysed. Besides the FTIR system, there are other continuous analysers and meters needed to complete the fume analysis by determining other parameters such as: particles, organic compounds, mercury, oxygen, temperature, flow rate and pressure. After the analysis system, a data acquisition system continuously provides the values obtained by calculating the half-hourly and daily averages of the concentrations measured, which are compared with the maximum admissible limit values set by the Control Bodies.
Emissions report average values of the last half hour
Type of emission | Average values | Status | ||
ND | 35 | 60 | ND | |
ND | 40 | 200 | ND | |
ND | 250 | 400 | ND | |
ND | - | - | ND | |
ND | 10 | 30 | ND | |
ND | 10 | 20 | ND | |
ND | - | - | ND | |
ND | 10 | 30 | ND |
Emissions report average daily values
10 | 50 | 50 | 200 | 10 | 10 | 30 | |||||||||||||||||||||||||||||||||||||||||||||||||||||||||||||||||||||||||||||||||||||||||||||
8 | 30 | 20 | 170 | 5 | 5 | 5 | |||||||||||||||||||||||||||||||||||||||||||||||||||||||||||||||||||||||||||||||||||||||||||||
27/04/2024 | Impianto fermo | ||||||||||||||||||||||||||||||||||||||||||||||||||||||||||||||||||||||||||||||||||||||||||||||||||
26/04/2024 | Impianto fermo | ||||||||||||||||||||||||||||||||||||||||||||||||||||||||||||||||||||||||||||||||||||||||||||||||||
25/04/2024 | Impianto fermo | ||||||||||||||||||||||||||||||||||||||||||||||||||||||||||||||||||||||||||||||||||||||||||||||||||
24/04/2024 | Impianto fermo | ||||||||||||||||||||||||||||||||||||||||||||||||||||||||||||||||||||||||||||||||||||||||||||||||||
23/04/2024 | Impianto fermo | ||||||||||||||||||||||||||||||||||||||||||||||||||||||||||||||||||||||||||||||||||||||||||||||||||
22/04/2024 | Impianto fermo | ||||||||||||||||||||||||||||||||||||||||||||||||||||||||||||||||||||||||||||||||||||||||||||||||||
21/04/2024 | 6,03 | 4,15 | 8,16 | 152,18 | 0 | 0,98 | 0,08 | ||||||||||||||||||||||||||||||||||||||||||||||||||||||||||||||||||||||||||||||||||||||||||||
20/04/2024 | 6,13 | 4,01 | 8,23 | 151,65 | 0 | 0,86 | 0,04 | ||||||||||||||||||||||||||||||||||||||||||||||||||||||||||||||||||||||||||||||||||||||||||||
19/04/2024 | 6,67 | 4,31 | 8,81 | 154,33 | 0 | 0,16 | 0,33 | ||||||||||||||||||||||||||||||||||||||||||||||||||||||||||||||||||||||||||||||||||||||||||||
18/04/2024 | 6,52 | 7,39 | 11,01 | 155,02 | 0 | 0,01 | 1,17 |
Select the year
Periodic self-checks for micropollutants - Year 2022
TIPO EMISSIONE | Linea 1 | limiti aia | Limiti 152/06 |
Cd+Tl (mg/Nm3) | 0,00153 | 0,03 | 0,05 |
Hg (mg/Nm3) | 0,0005 | 0,03 | 0,05 |
Metalli (mg/Nm3) | 0,017 | 0,3 | 0,5 |
Diossine (ng/Nm3) | 0,0011 | 0,05 | 0,1 |
IPA (mg/Nm3) | 0,00001 | 0,005 | 0,01 |
PCB (ng/Nm3) | 0,00011 | 0,05 | 0,1 |