Canvas_Term_Bologna_ENG

  • View of Bologna waste-to-energy plant

    Bologna waste-to-energy plant

    FEA - Via del Frullo 5, Granarolo dell'Emilia (BO)

    Waste-to-energy plant

    Municipal waste, hazardous and non-hazardous special waste

  • People at work Bologna waste-to-energy plant

    Bologna waste-to-energy plant

    Via del Frullo 5, Granarolo dell'Emilia (BO)

  • Technology of Bologna waste-to-energy plant

    Bologna waste-to-energy plant

    Via del Frullo 5, Granarolo dell'Emilia (BO)

    TS_Term_Bologna_ENG

    Overview

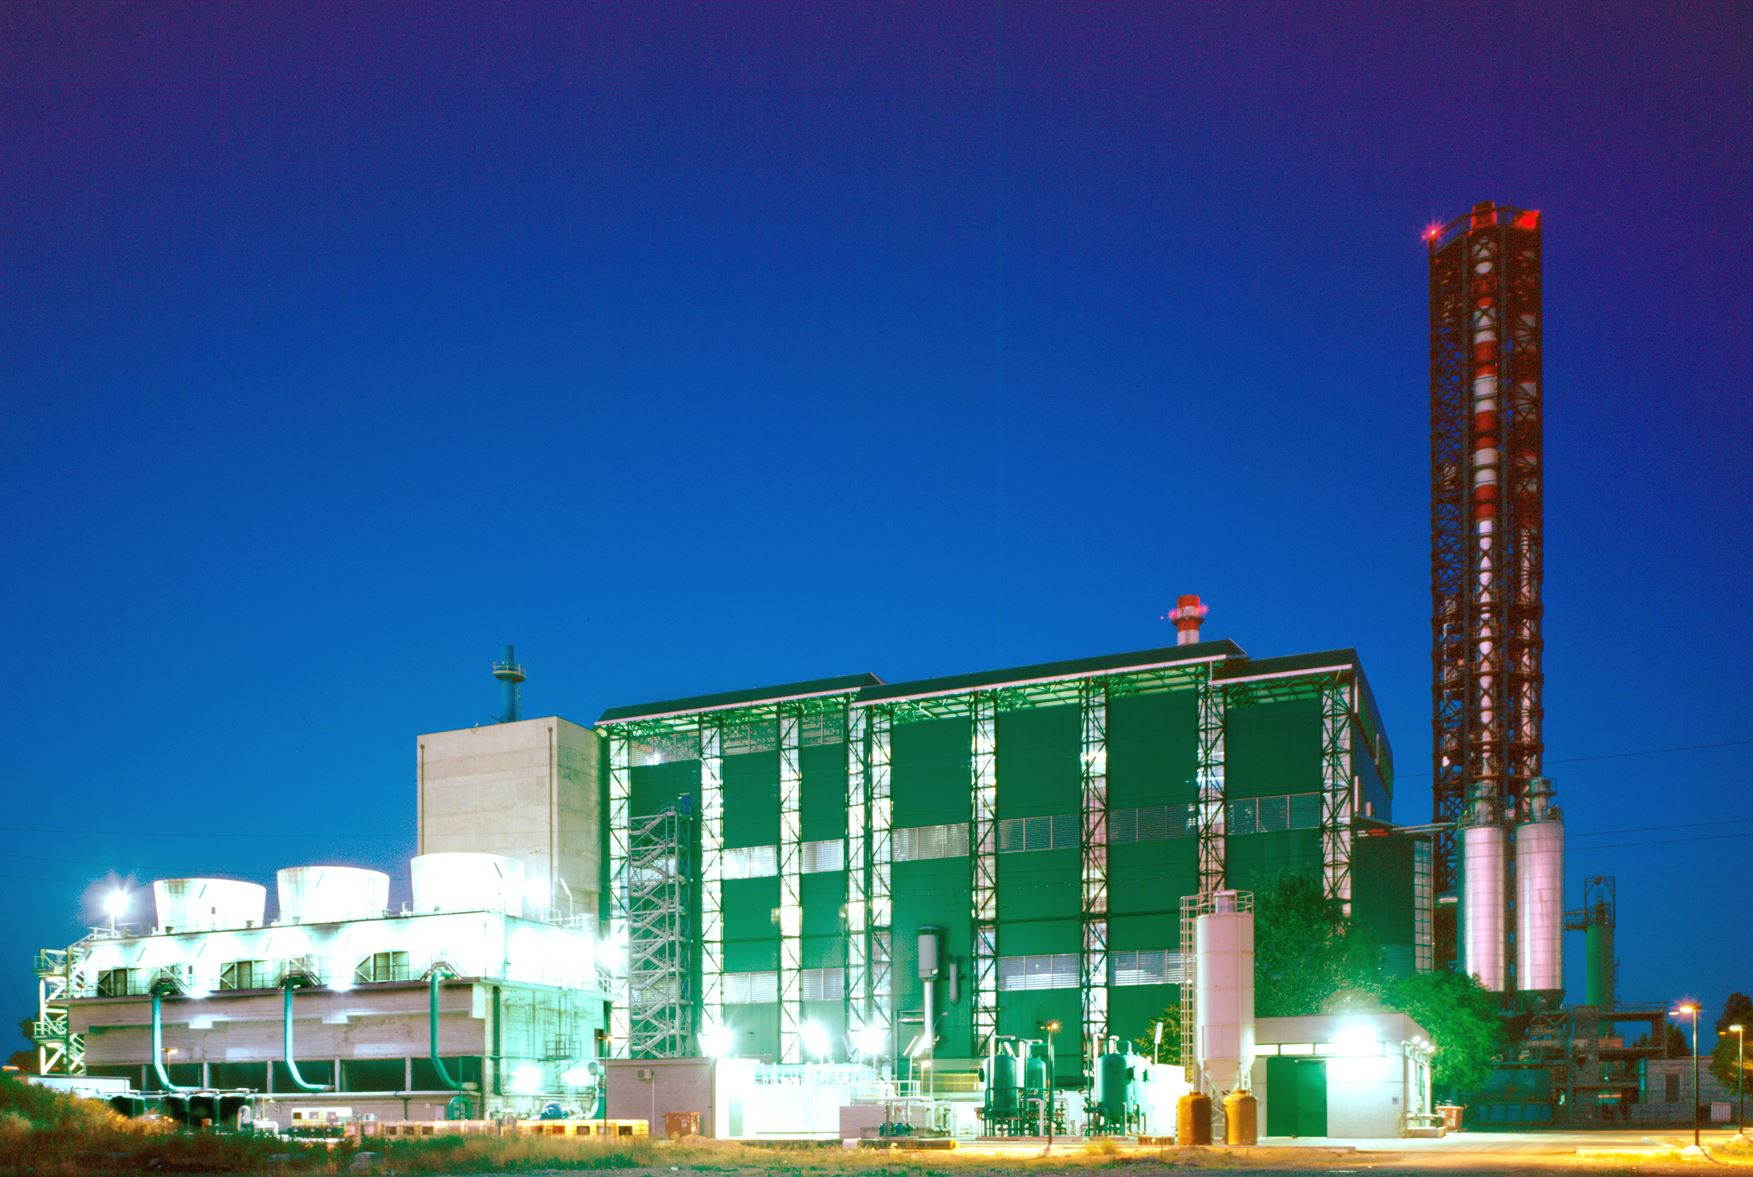
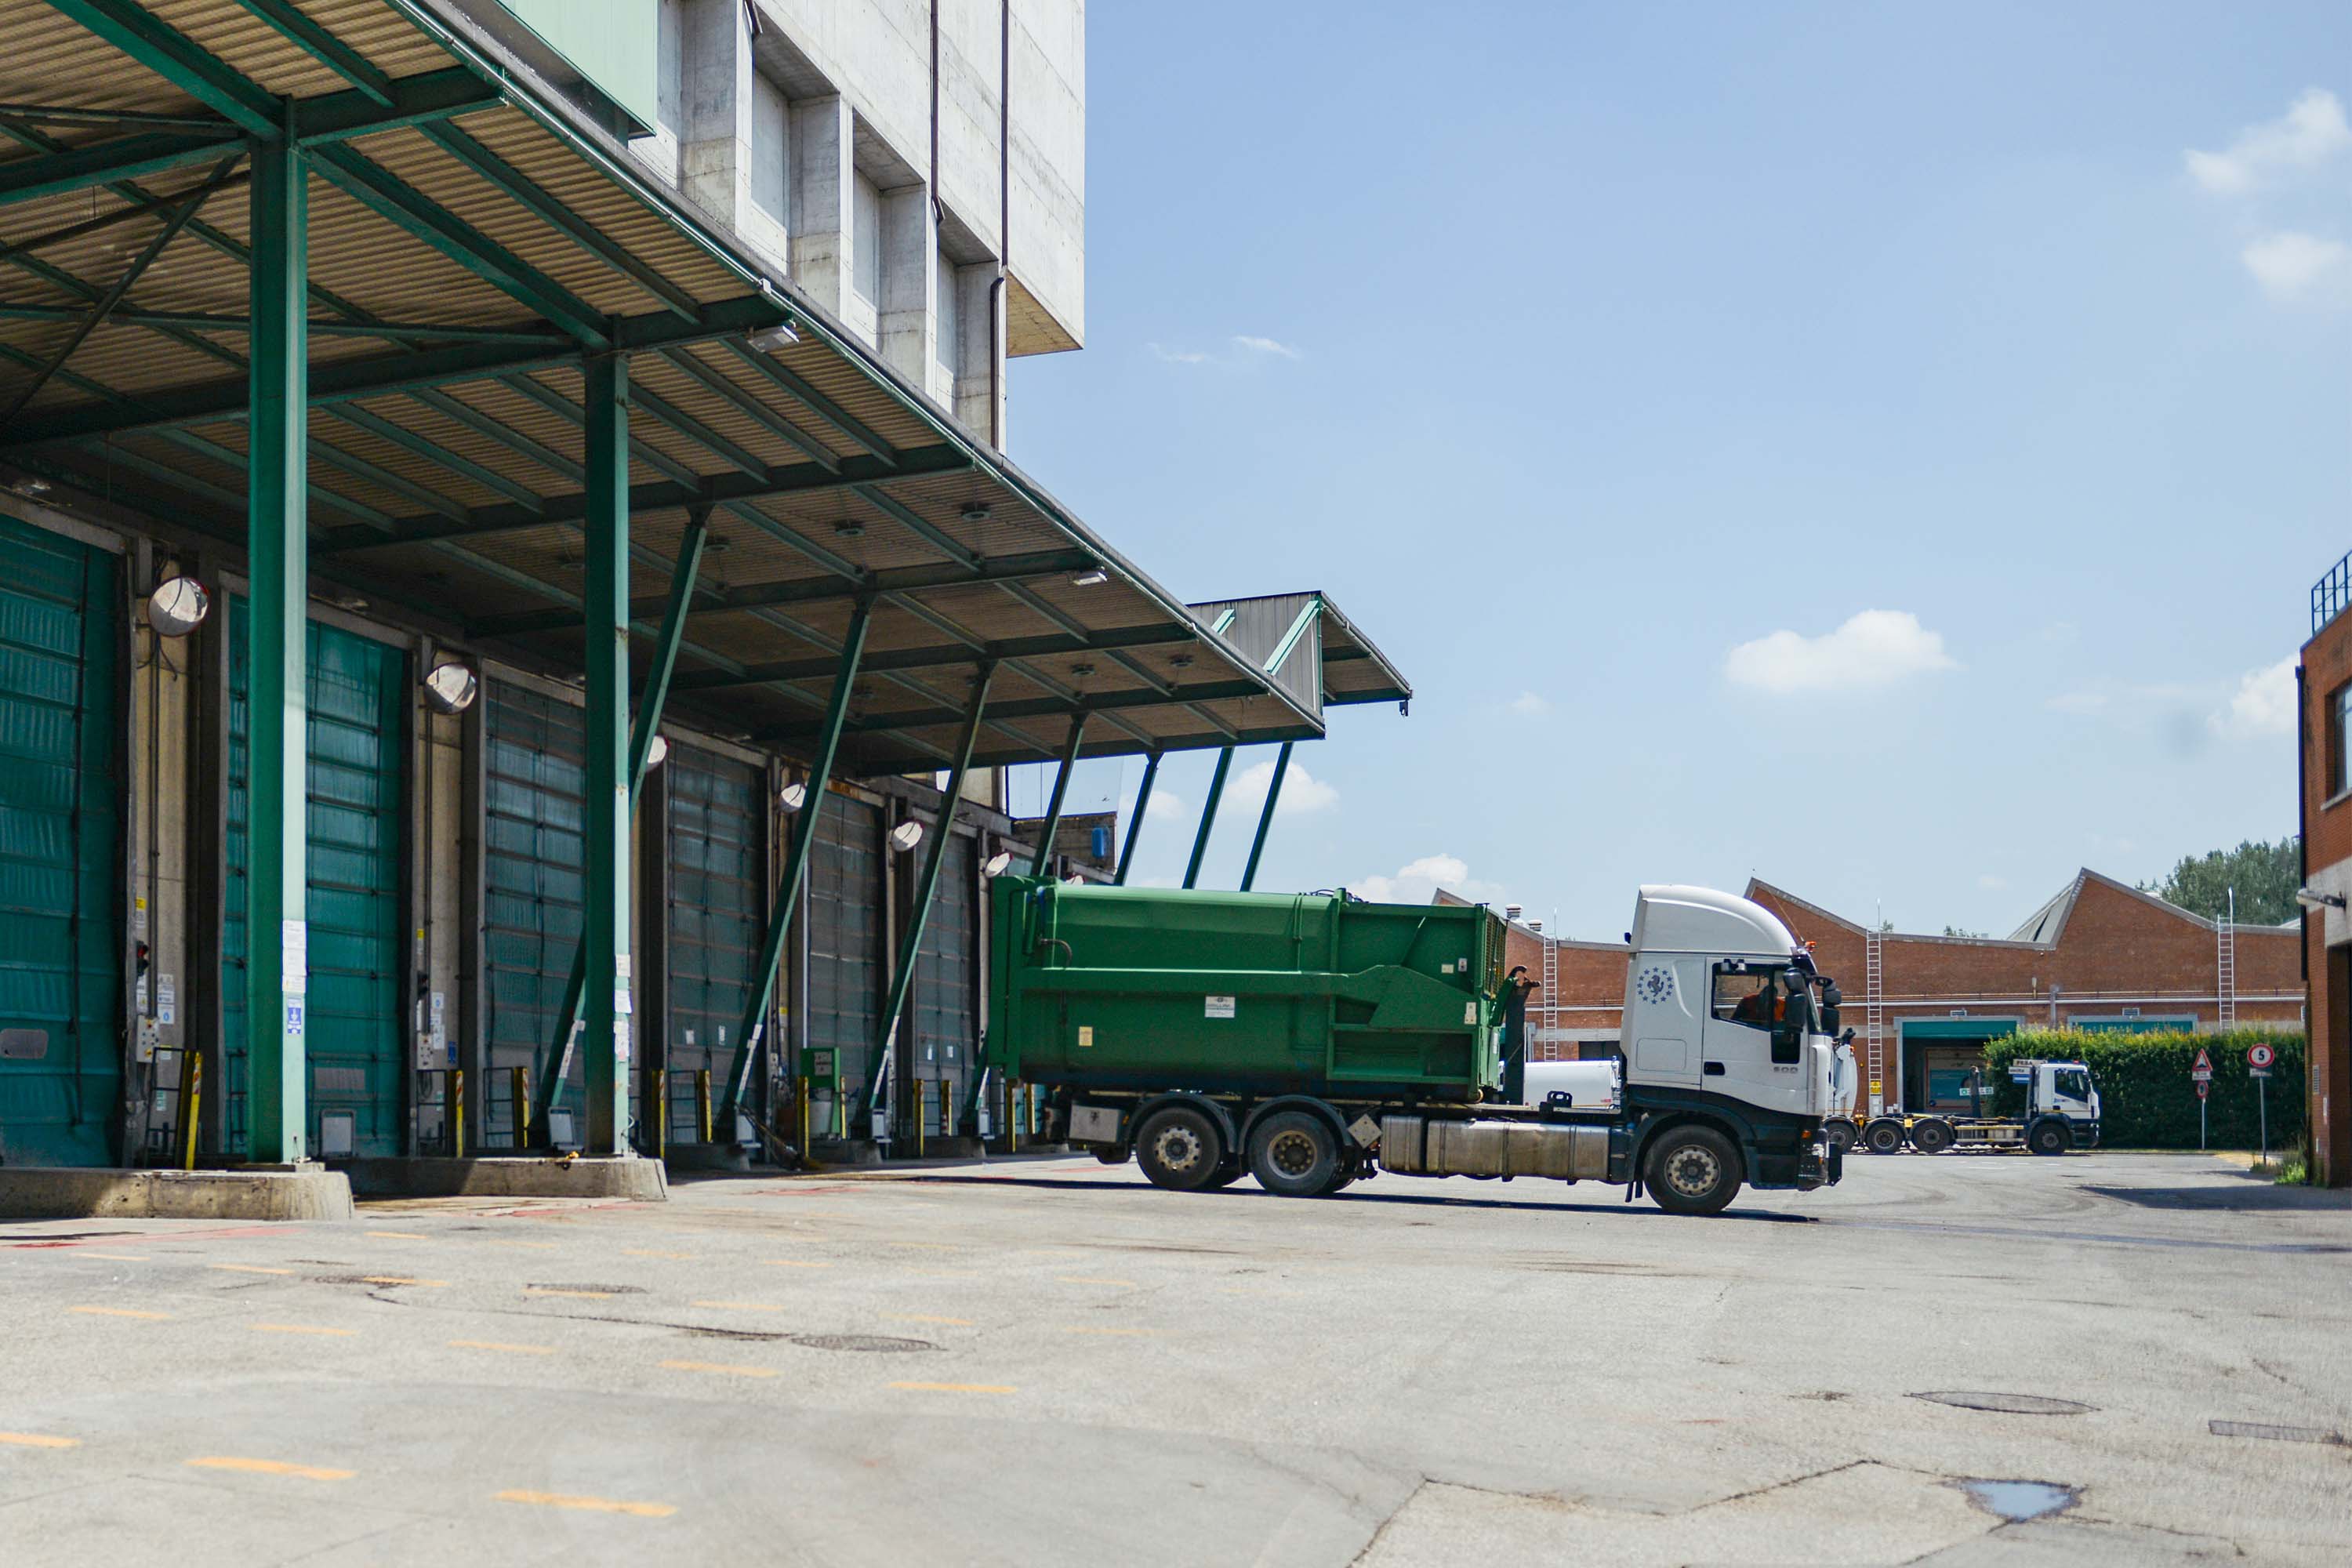
    The waste to energy plant in Bologna processes solid urban waste and non hazardous and hazardous special waste (healthcare with an infectious risk).

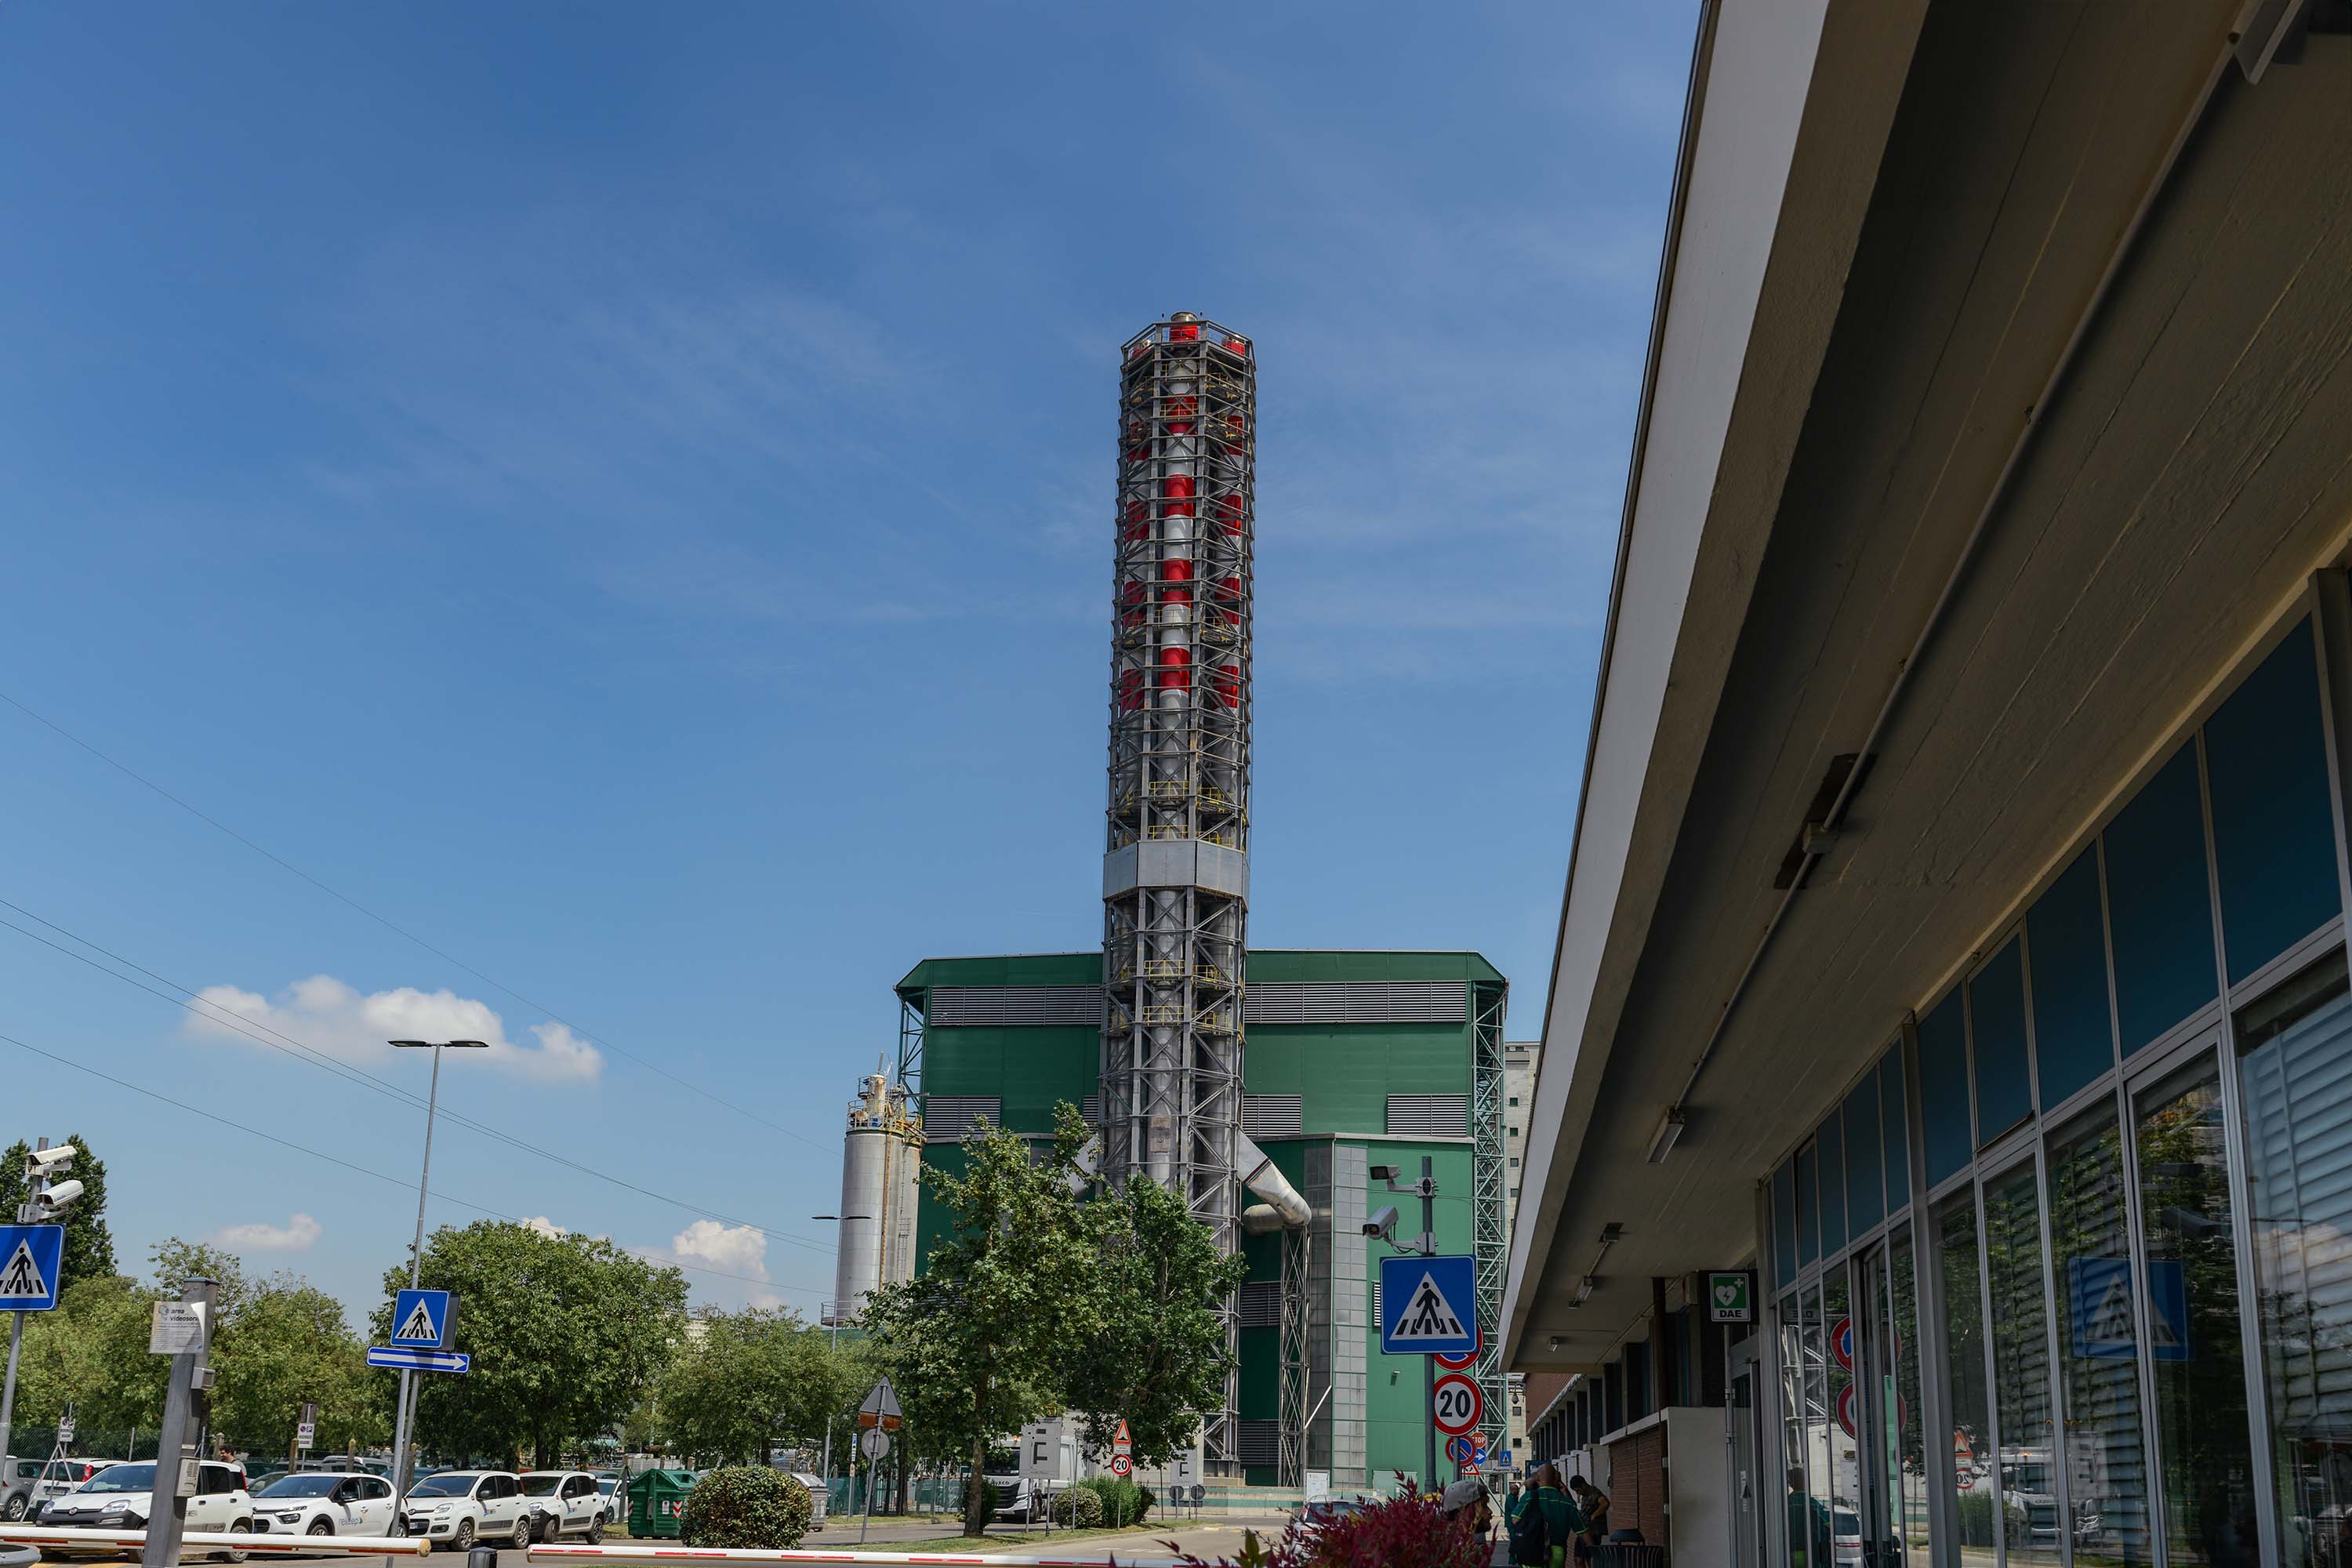
    The construction of the plant began in 1971 with the construction of three disposal lines with a potential of 200 tons of waste per day each. The first two lines went into operation in 1973, while the third began to be used the following year. From 1987 to 1997, the plant underwent various plant and technological modifications to adapt to constantly evolving European legislation.

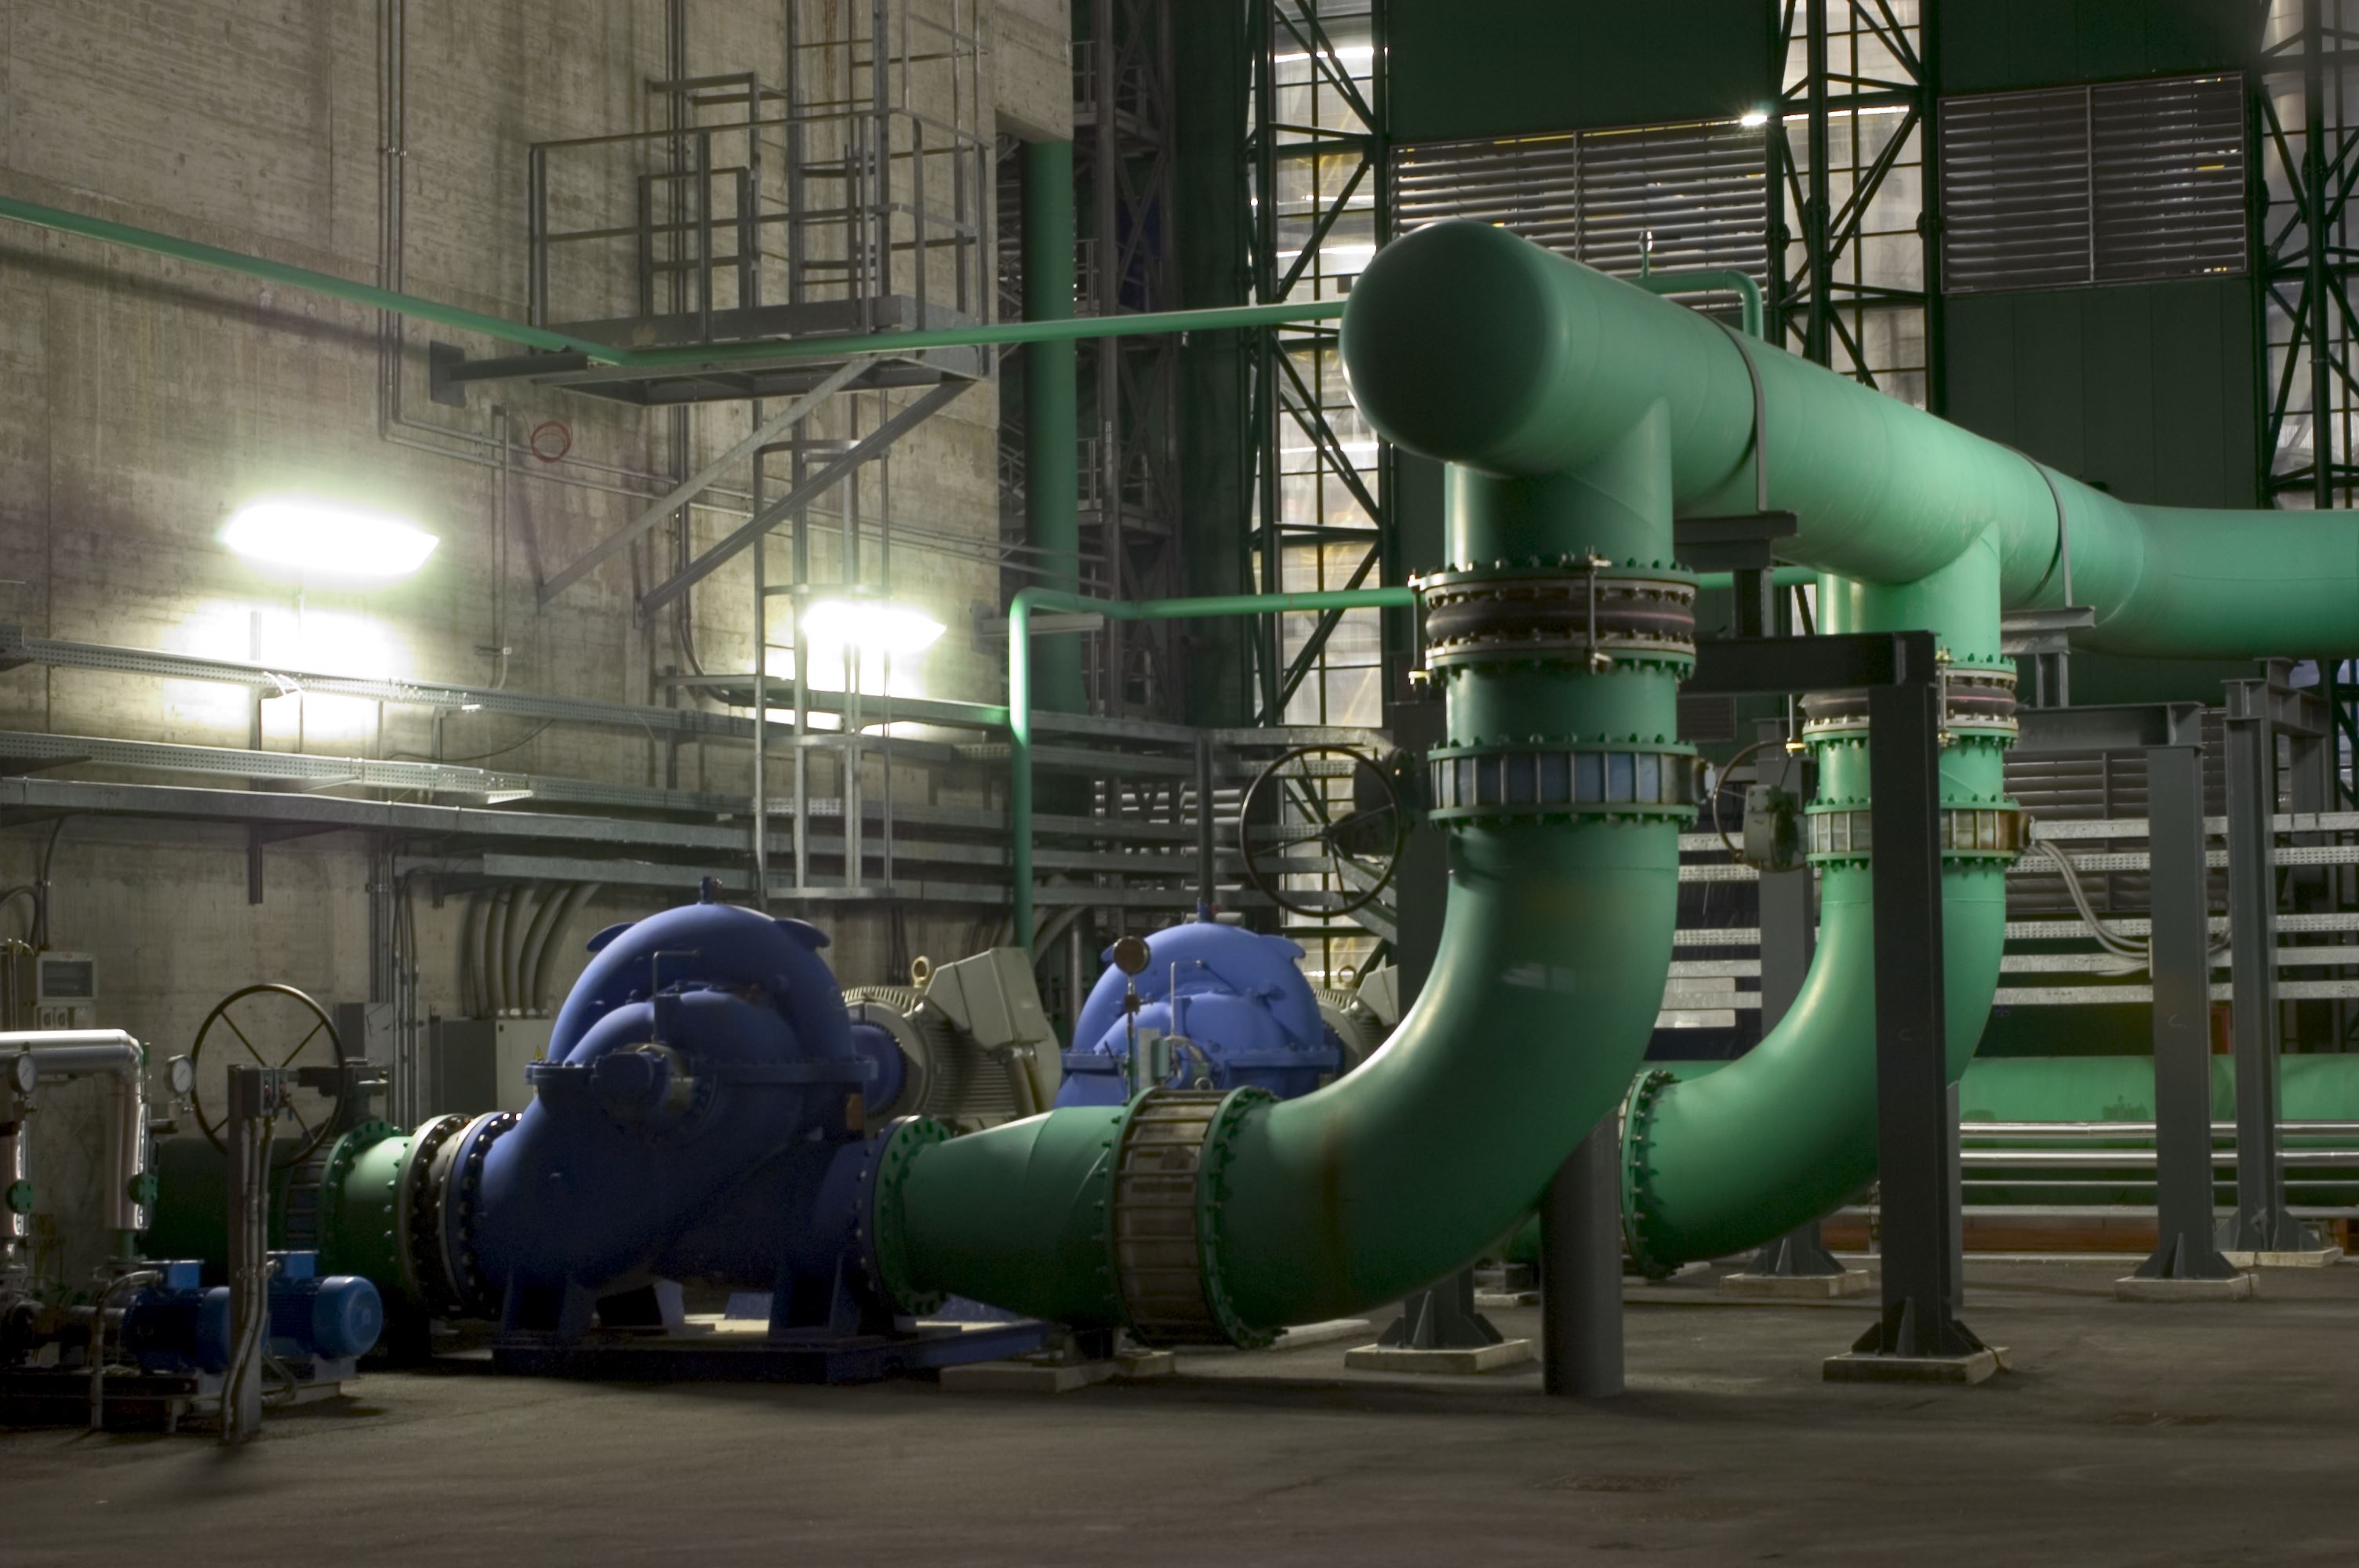
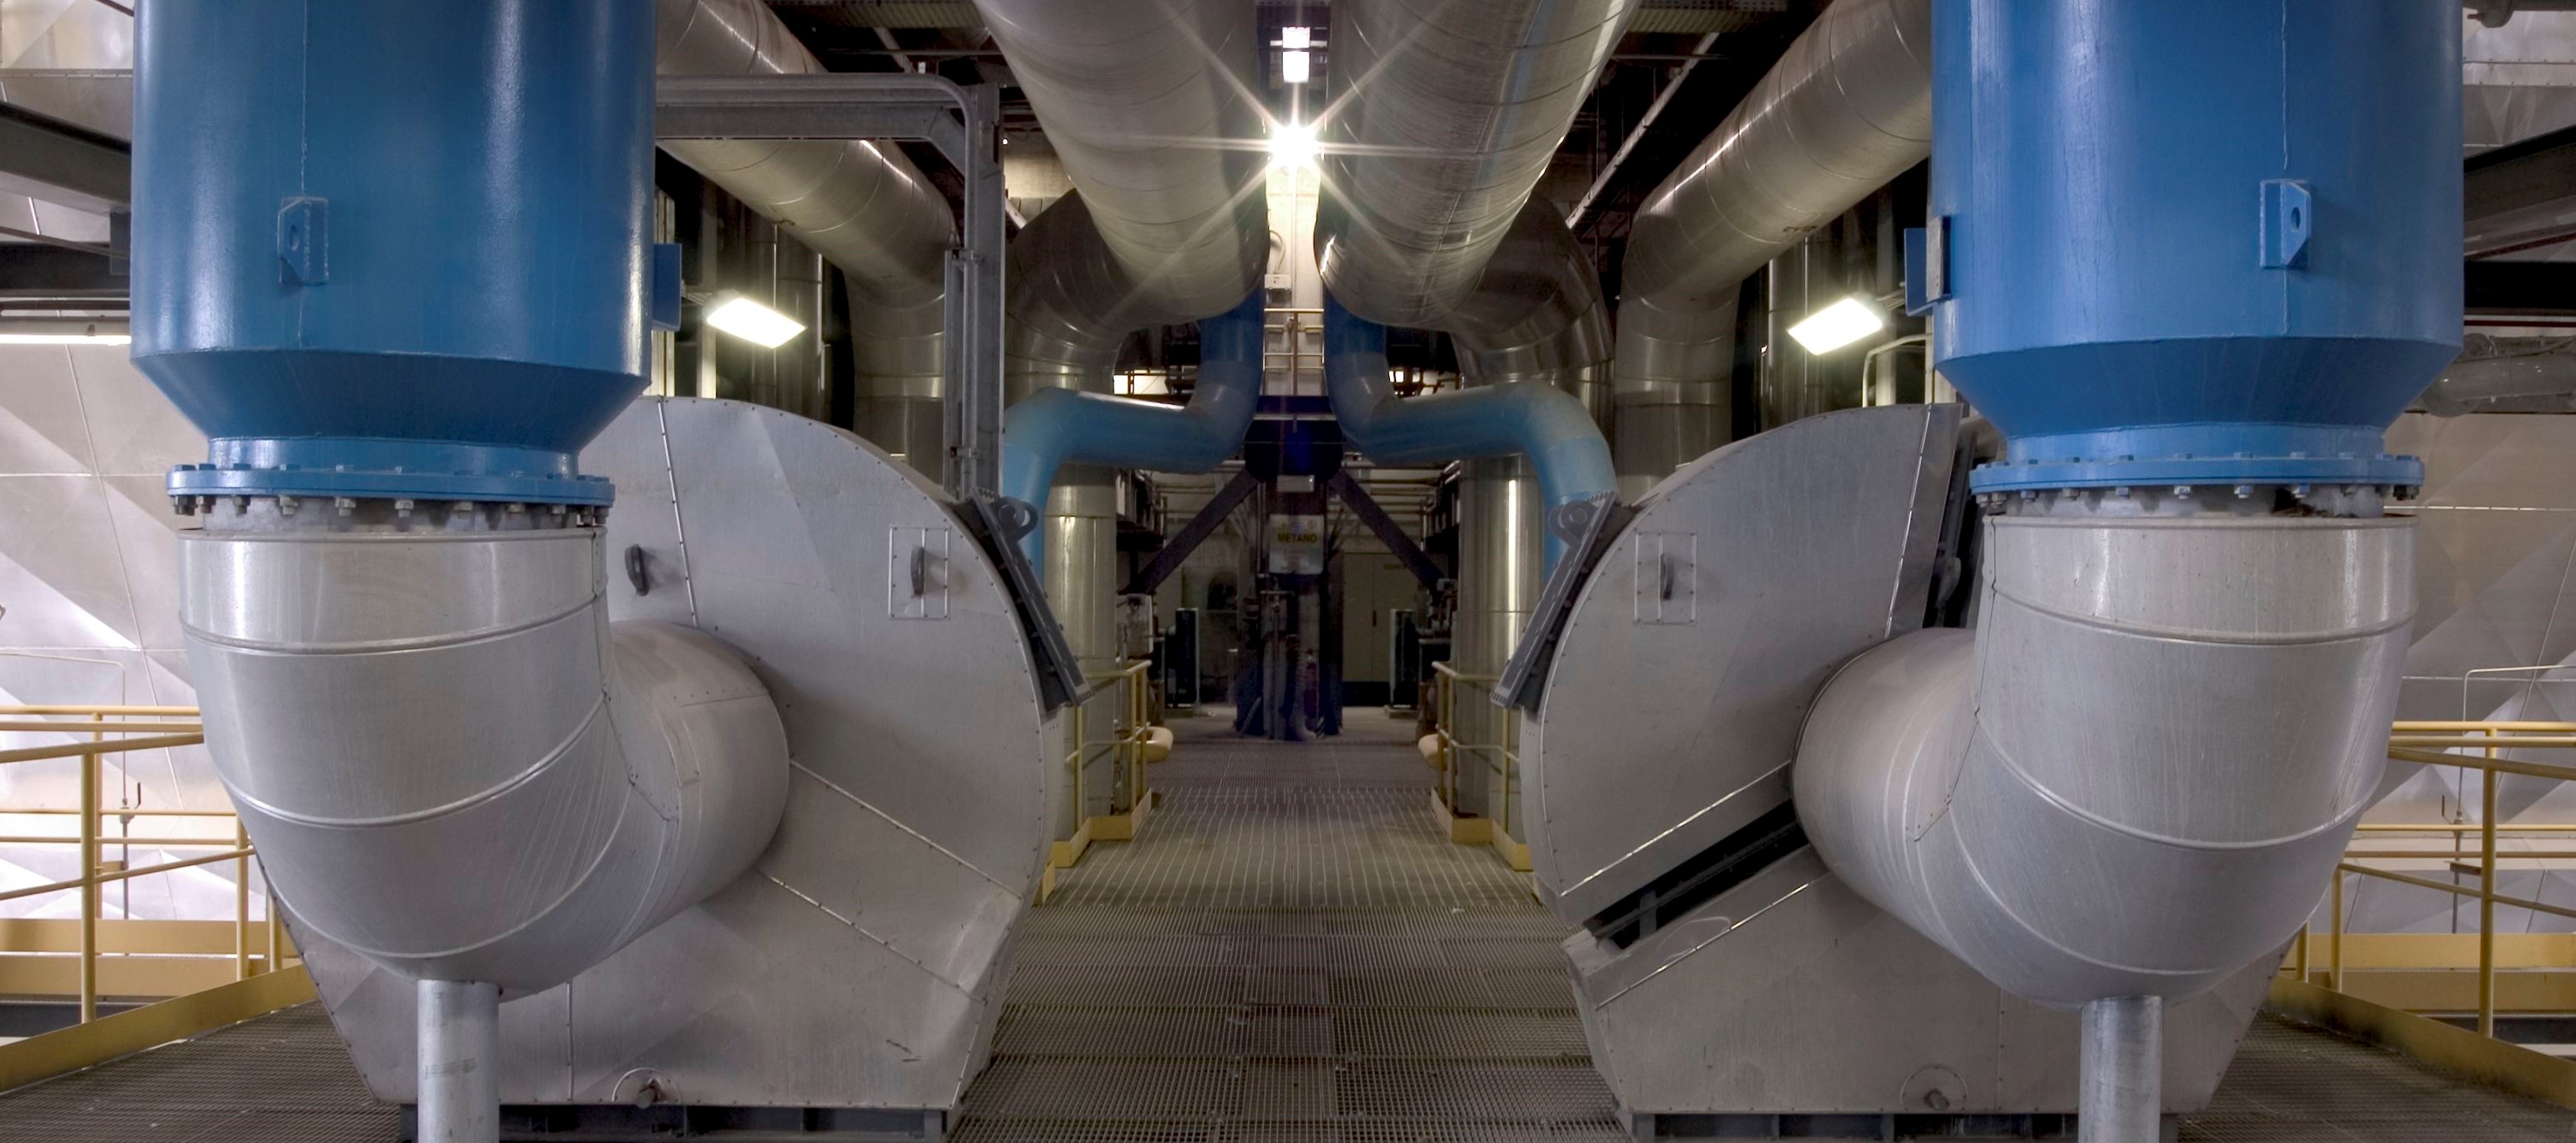
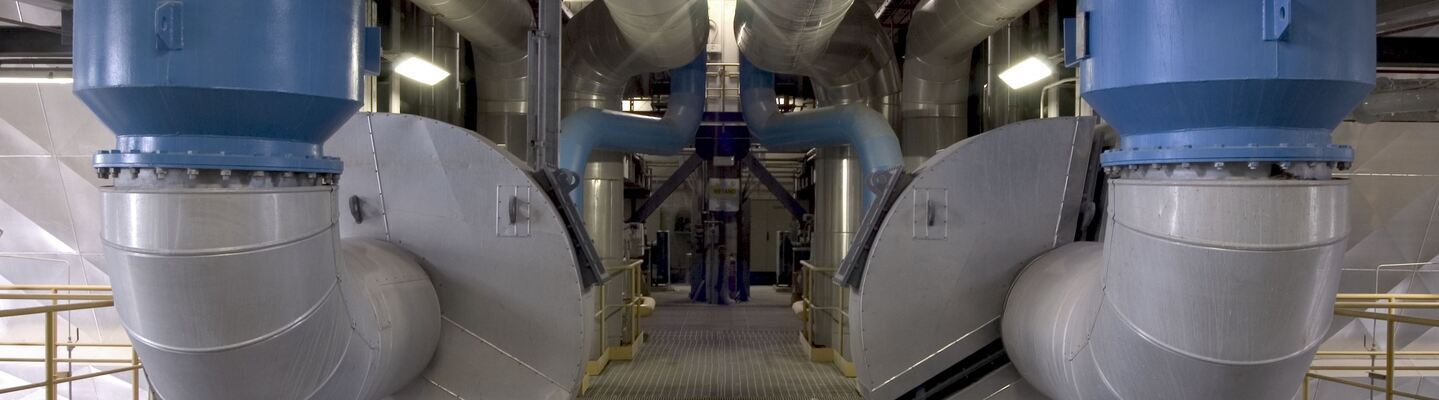
    The Bologna waste to energy plant underwent a technological modernization and redevelopment work in 2001, completed in 2004. Since then it has had the same plant configuration. The structure consists of 2 parallel and independent waste to energy lines, which each treat 300 tons of waste per day, with relative energy recovery implemented through a cogeneration plant. The plant produces approximately 140 million kWh per year of electricity destined for the national grid, and approximately 45 million Mcal per year of thermal energy for the district heating network.

    The technological characteristics of the plant have been selected paying particular attention to the criteria of maximum guarantee of environmental protection, reliability and operational safety, technological process and product innovation and high energy efficiency.

    Page updated December 2022

    ListInfo_term_Bologna_ENG

    Form

    Environmental compatibility in compliance with current legislation (Legislative Decree 152/06)

    • Number of waste to energy lines
      2
    • Surface area of the FEA site
      83.184 m2
    • Total thermal capacity
      Approximately 81.41 MWt
    • Combustion technology
      Water and air cooled moving grate incinerators
    • Waste disposal capacity
      600 tonnes/d with LCV of 2,800 Kcal/Kg
    • Annual operation
      Approximately 15,000 hours
    • Rated electric power
      22 MW
    • Recovery code
      R1
    • Type of waste accepted
      Municipal waste; non hazardous special waste; hazardous special waste (or hospital waste with infection risk and cancer chemotherapies) up to a maximum of 3,500 tonnes/year

    TextIMG_Term_Bologna_ENG

    Vista esterna del termovalorizzatore di Bologna

    Technology

    How does the plant work?

    The waste-to-energy plant makes it possible to dispose of a variety of waste through combustion. The heat this generates is exploited to produce heat and electricity.

    Title_Term_Bologna_ENG

    Operating phases

    Accordion_Term_Bologna_ENG

    BI_Term_Bologna_ENG

    TS_TERM_Emission_Bologna_ENG

    Emission monitoring

    A continuous monitoring system, installed on the chimney, analyses all the main parameters at one minute intervals, then stores and logs them according to national laws. The data are transmitted to the controlling bodies.

    HeraTermovalorizzatoriGestoreDati

    A continuous monitoring system, installed on the chimney, analyses all the main parameters at one minute intervals, then stores and logs them according to national laws. The data are transmitted to the controlling bodies. All testing equipment is certified by TÜV (German Certification Body), in order to offer the best guarantees of quality and reliability. The continuously monitored parameters are: CO (carbon monoxide), CO2 (carbon dioxide), SPM (suspended particulate matter), SOx (sulfur oxides), NOx (nitrogen oxides), NH3 (ammonia), HF (hydrogen fluoride), HCl (hydrochloric acid), TOC (total organic carbon), O2 (oxygen), temperature, humidity and fumes pressure. Periodically, further tests are carried out with direct sampling in the chimney, using instruments and methods provided for by law; these measurements are performed by accredited laboratories. It should be noted that the limit values prescribed for atmospheric emissions by local authorities are much more restrictive than those established at national level. Since 2009, the control over emissions to the atmosphere has been increased through sampling and the discontinuous analysis of PCDD + PCDF (dioxins) and Hg (mercury) parameters. Furthermore, a backup system for gas analysis at the chimney has been installed, guaranteeing continuous monitoring also in case of main system failure.

    Emissions report average values of the last half hour

    Type of emission Average values Status
    0 50 60 OK
    2,53 150 200 OK
    71,57 300 400 OK
    0 2 4 OK
    0 20 30 OK
    0,05 20 20 OK
    2,48 10 60 OK

    Emissions report average daily values

    10 50 50 200 1 10 10 30
    5 30 25 100 1 5 10 10
    03/05/2024 2,33 11,37 7,55 65,36 0,06 0,2 0,15 1,71
    02/05/2024 2,19 11,56 8,61 70,12 0,06 0,2 0,16 1,94
    01/05/2024 1,29 6,02 6,06 66,3 0,06 0,2 0,16 2,69
    30/04/2024 0,57 7,29 5,82 65,95 0,06 0,2 0,15 1,93
    29/04/2024 1,45 7,63 5,06 62,35 0,06 0,2 0,18 2,07
    28/04/2024 0,89 8,59 5,9 67,59 0,06 0,2 0,15 2,17
    27/04/2024 0,66 15,98 4,77 62,53 0,06 0,2 0,17 1,92
    26/04/2024 0,58 12 7,52 64,53 0,06 0,2 0,22 1,94
    25/04/2024 0,32 13,66 3,59 63,91 0,06 0,2 0,25 1,86
    24/04/2024 1,63 9,62 5,17 69,13 0,06 0,2 0,15 2,42

    Select the year

    Type of emission Value
    10 5 2,33
    50 30 11,37
    50 25 7,55
    200 100 65,36
    1 1 0,06
    10 5 0,2
    10 10 0,15
    30 10 1,71

    Periodic self-checks for micropollutants - Year 2022

    TIPO EMISSIONE Linea 1 limiti aia Limiti 152/06
    Cd+Tl (mg/Nm3) 0,00060 0,05 0,05
    Hg (mg/Nm3) 0,00016 0,05 0,05
    Metalli (mg/Nm3) 0,00661 0,5 0,5
    Diossine (ng/Nm3) 0,00014 0,1 0,1
    IPA (mg/Nm3) 0,0000032 0,001 0,01
    PCB (ng/Nm3) 0,00021 0,1 0,1


    Select the year

    Emissions report average values of the last half hour

    Type of emission Average values Status
    0 50 60 OK
    2,27 150 200 OK
    77,58 300 400 OK
    0,01 2 4 OK
    0 20 30 OK
    0,51 20 20 OK
    4,17 10 60 OK

    Emissions report average daily values

    10 50 50 200 1 10 10 30
    5 30 25 100 1 5 10 10
    03/05/2024 0,84 15,68 6,64 87,34 0,06 0,2 0,54 3,22
    02/05/2024 3,15 12,34 13,7 90,39 0,06 0,2 0,54 4,03
    01/05/2024 1,41 9,08 9,34 85,85 0,06 0,2 0,53 3,75
    30/04/2024 0,89 10,95 9,31 89,02 0,06 0,2 0,36 3,87
    29/04/2024 0,98 10,71 8 88,28 0,06 0,2 0,21 3,29
    28/04/2024 0,44 12,13 8,5 86,05 0,06 0,2 0,22 4,13
    27/04/2024 0,43 10,35 6,69 90,56 0,06 0,2 0,19 4,11
    26/04/2024 0,2 11,24 8,03 83,26 0,06 0,2 0,29 3,54
    25/04/2024 0,13 15,32 4,17 89,08 0,06 0,2 0,59 1,67
    24/04/2024 0,27 11,7 5,9 92,39 0,06 0,2 0,53 3,24

    Select the year

    Type of emission Value
    10 5 0,84
    50 30 15,68
    50 25 6,64
    200 100 87,34
    1 1 0,06
    10 5 0,2
    10 10 0,54
    30 10 3,22

    Periodic self-checks for micropollutants - Year 2022

    TIPO EMISSIONE Linea 2 limiti aia Limiti 152/06
    Cd+Tl (mg/Nm3) 0,00062 0,05 0,05
    Hg (mg/Nm3) 0,00019 0,05 0,05
    Metalli (mg/Nm3) 0,00813 0,5 0,5
    Diossine (ng/Nm3) 0,00041 0,1 0,1
    IPA (mg/Nm3) 0,0000023 0,001 0,01
    PCB (ng/Nm3) 0,00020 0,1 0,1


    Select the year

    Docs_Term_Bologna_ENG

    BLink2_Term_Bologna_ENG

    LinkGenerico_DocPeraccedereagliimpianti_ENG+

    BLink_Term_Bologna_ENG

    LCross_Term_Bologna_ENG

    BackgroundCrosslink

    Chosen for you

    You might also be interested in...