
-
Modena waste-to-energy plant
Via Cavazza 45, Modena, Italy
Waste-to-energy plant
Municipal waste, non-hazardous special waste
-
Via Cavazza 45, Modena, Italy
Waste-to-energy plant
Municipal waste, non-hazardous special waste
-
Via Cavazza 45, Modena, Italy
Waste-to-energy plant
Municipal waste, non-hazardous special waste
-
Via Cavazza 45, Modena, Italy
Waste-to-energy plant
Municipal waste, non-hazardous special waste
-
Via Cavazza 45, Modena, Italy
Waste-to-energy plant
Municipal waste, non-hazardous special waste
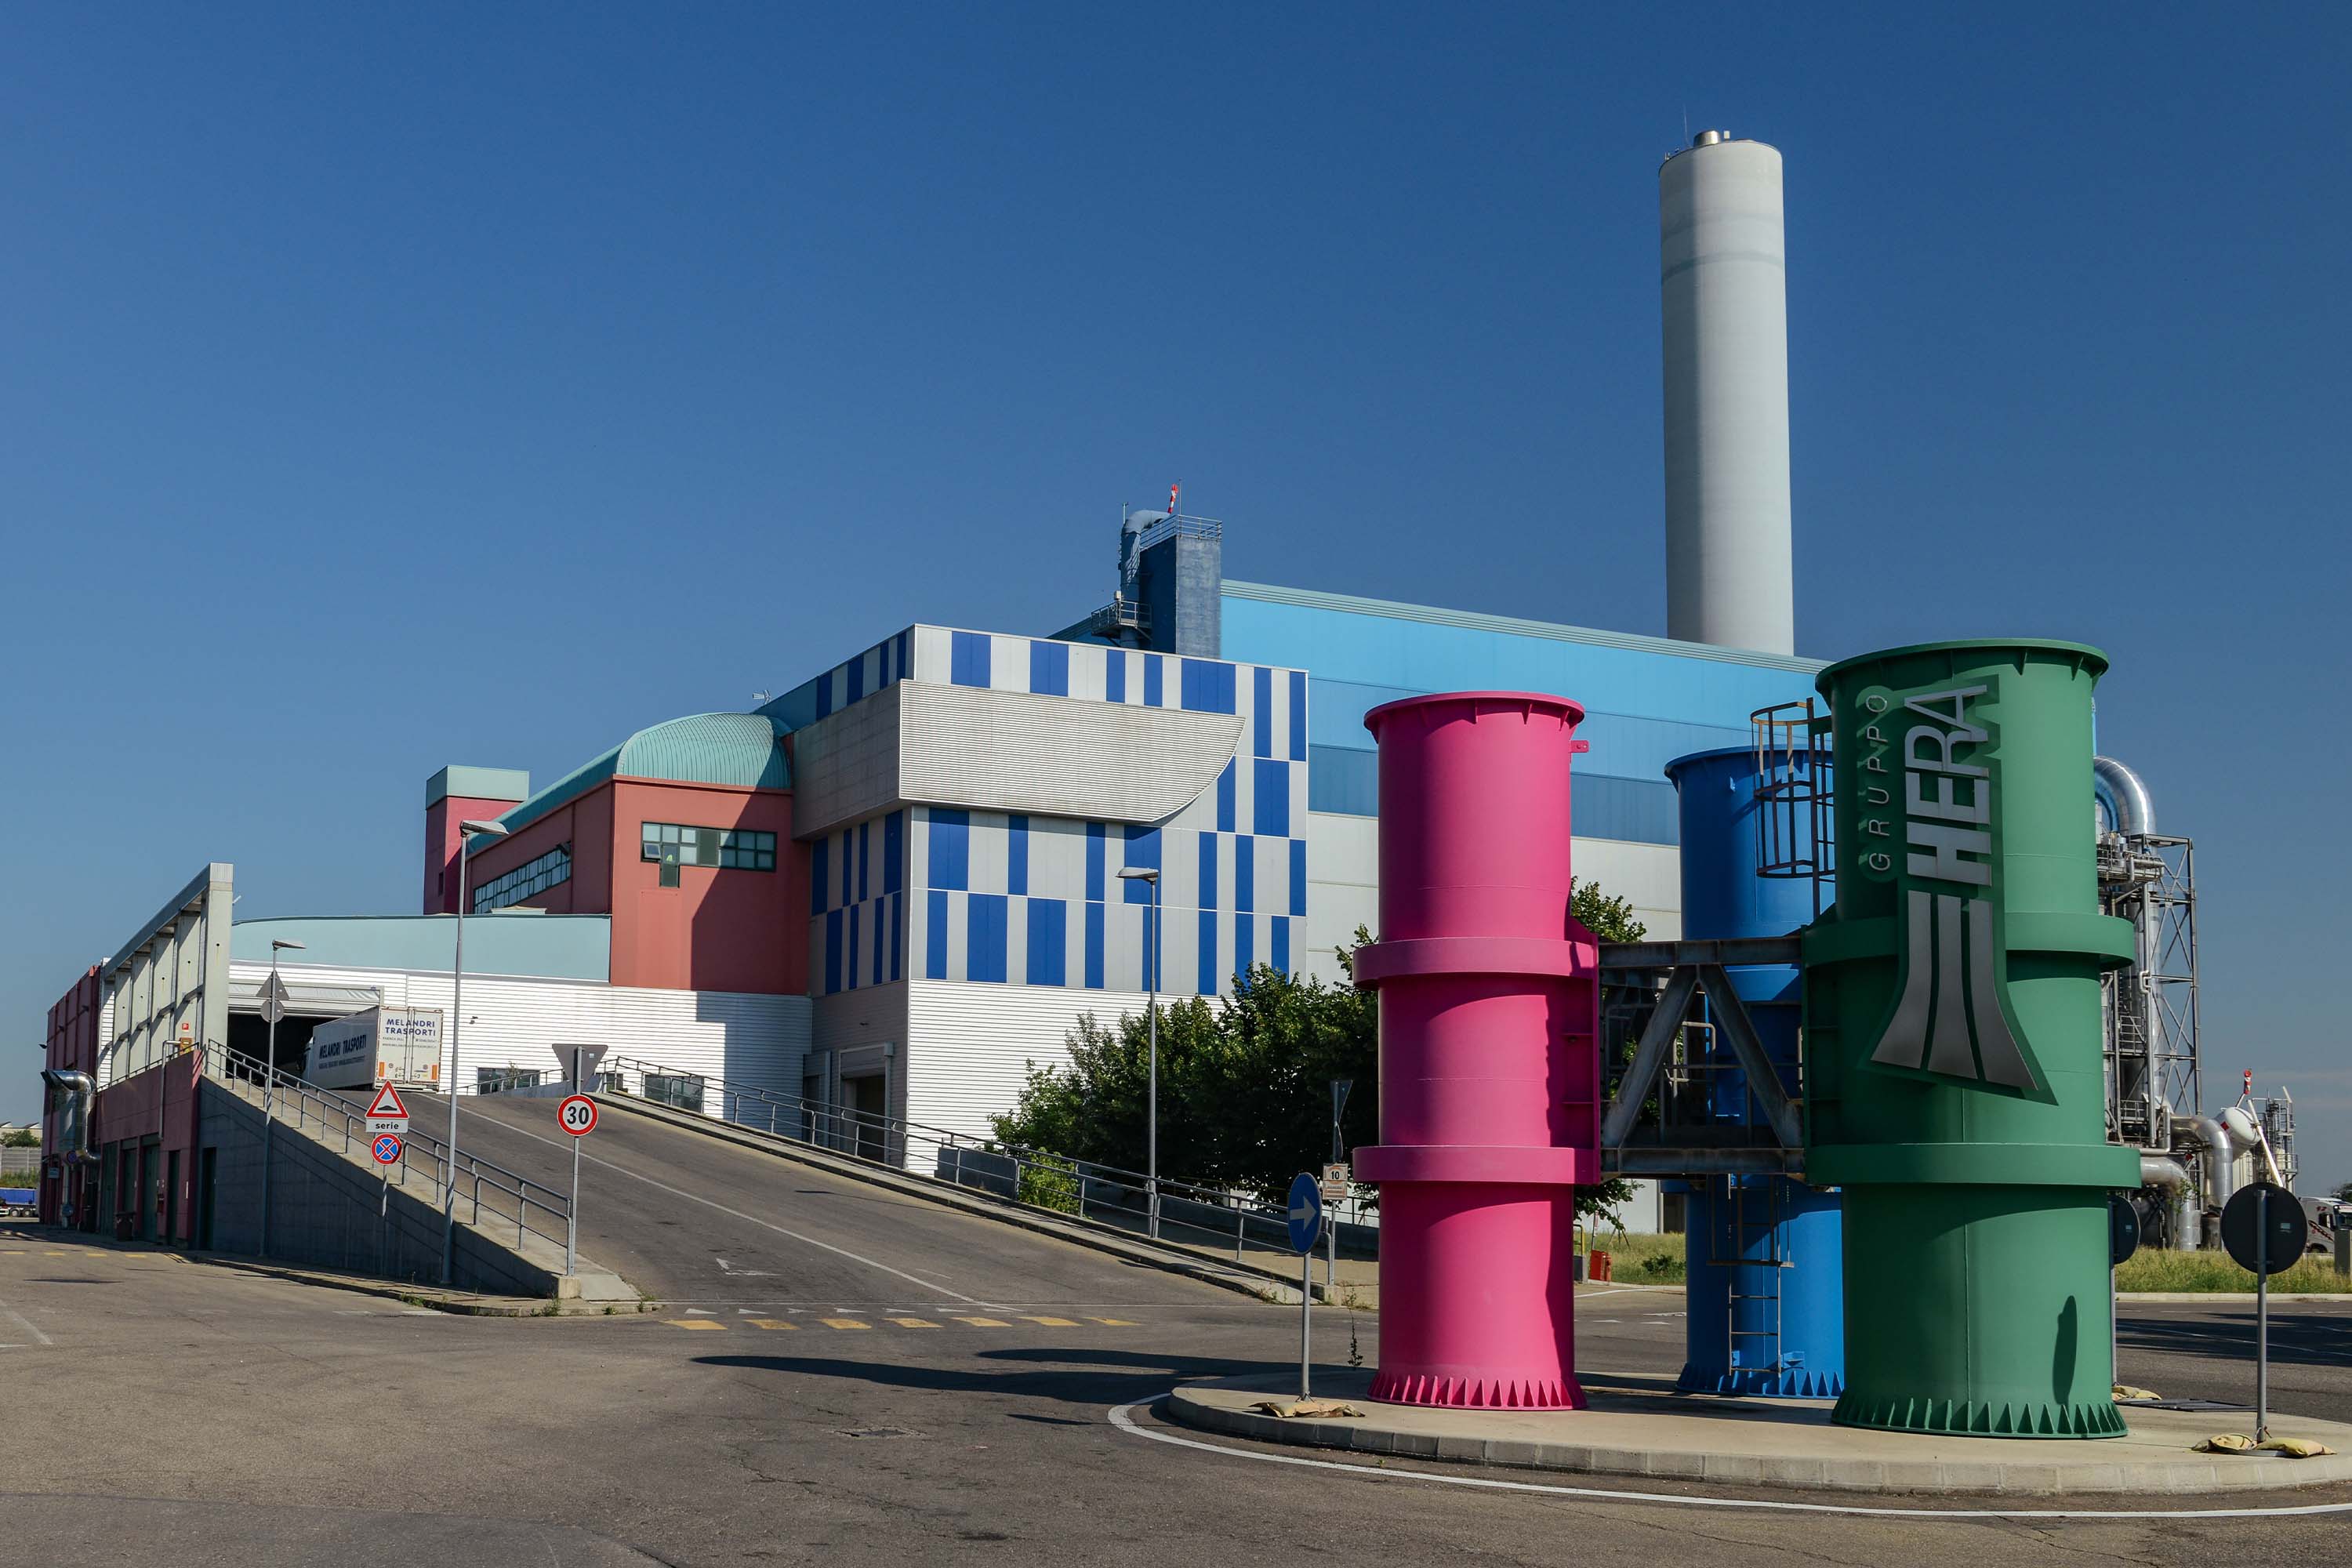
Overview
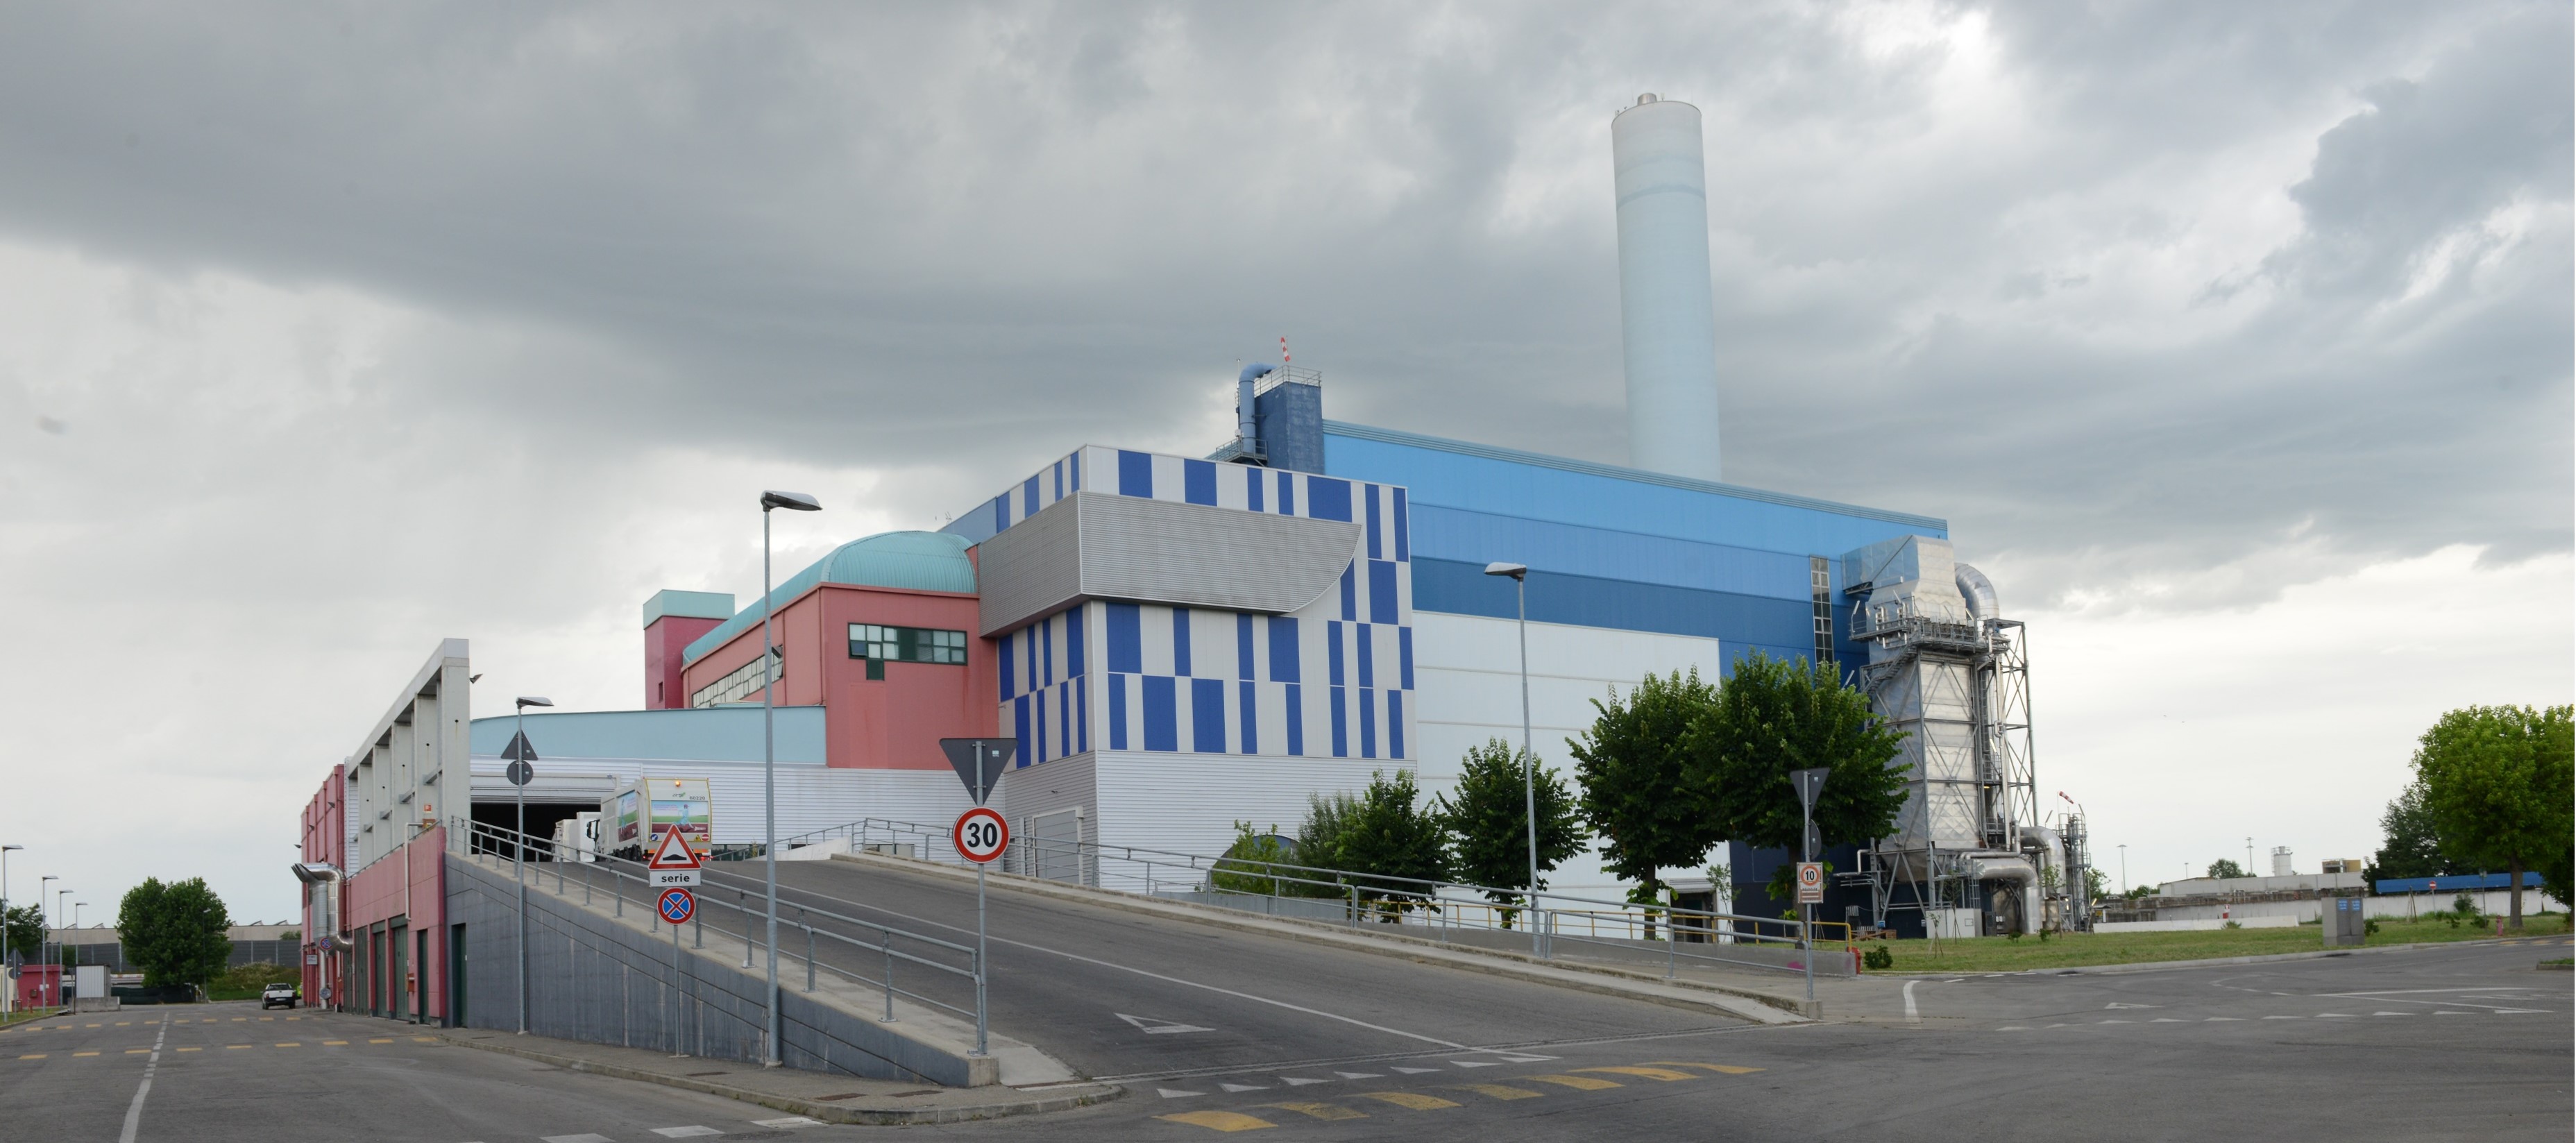
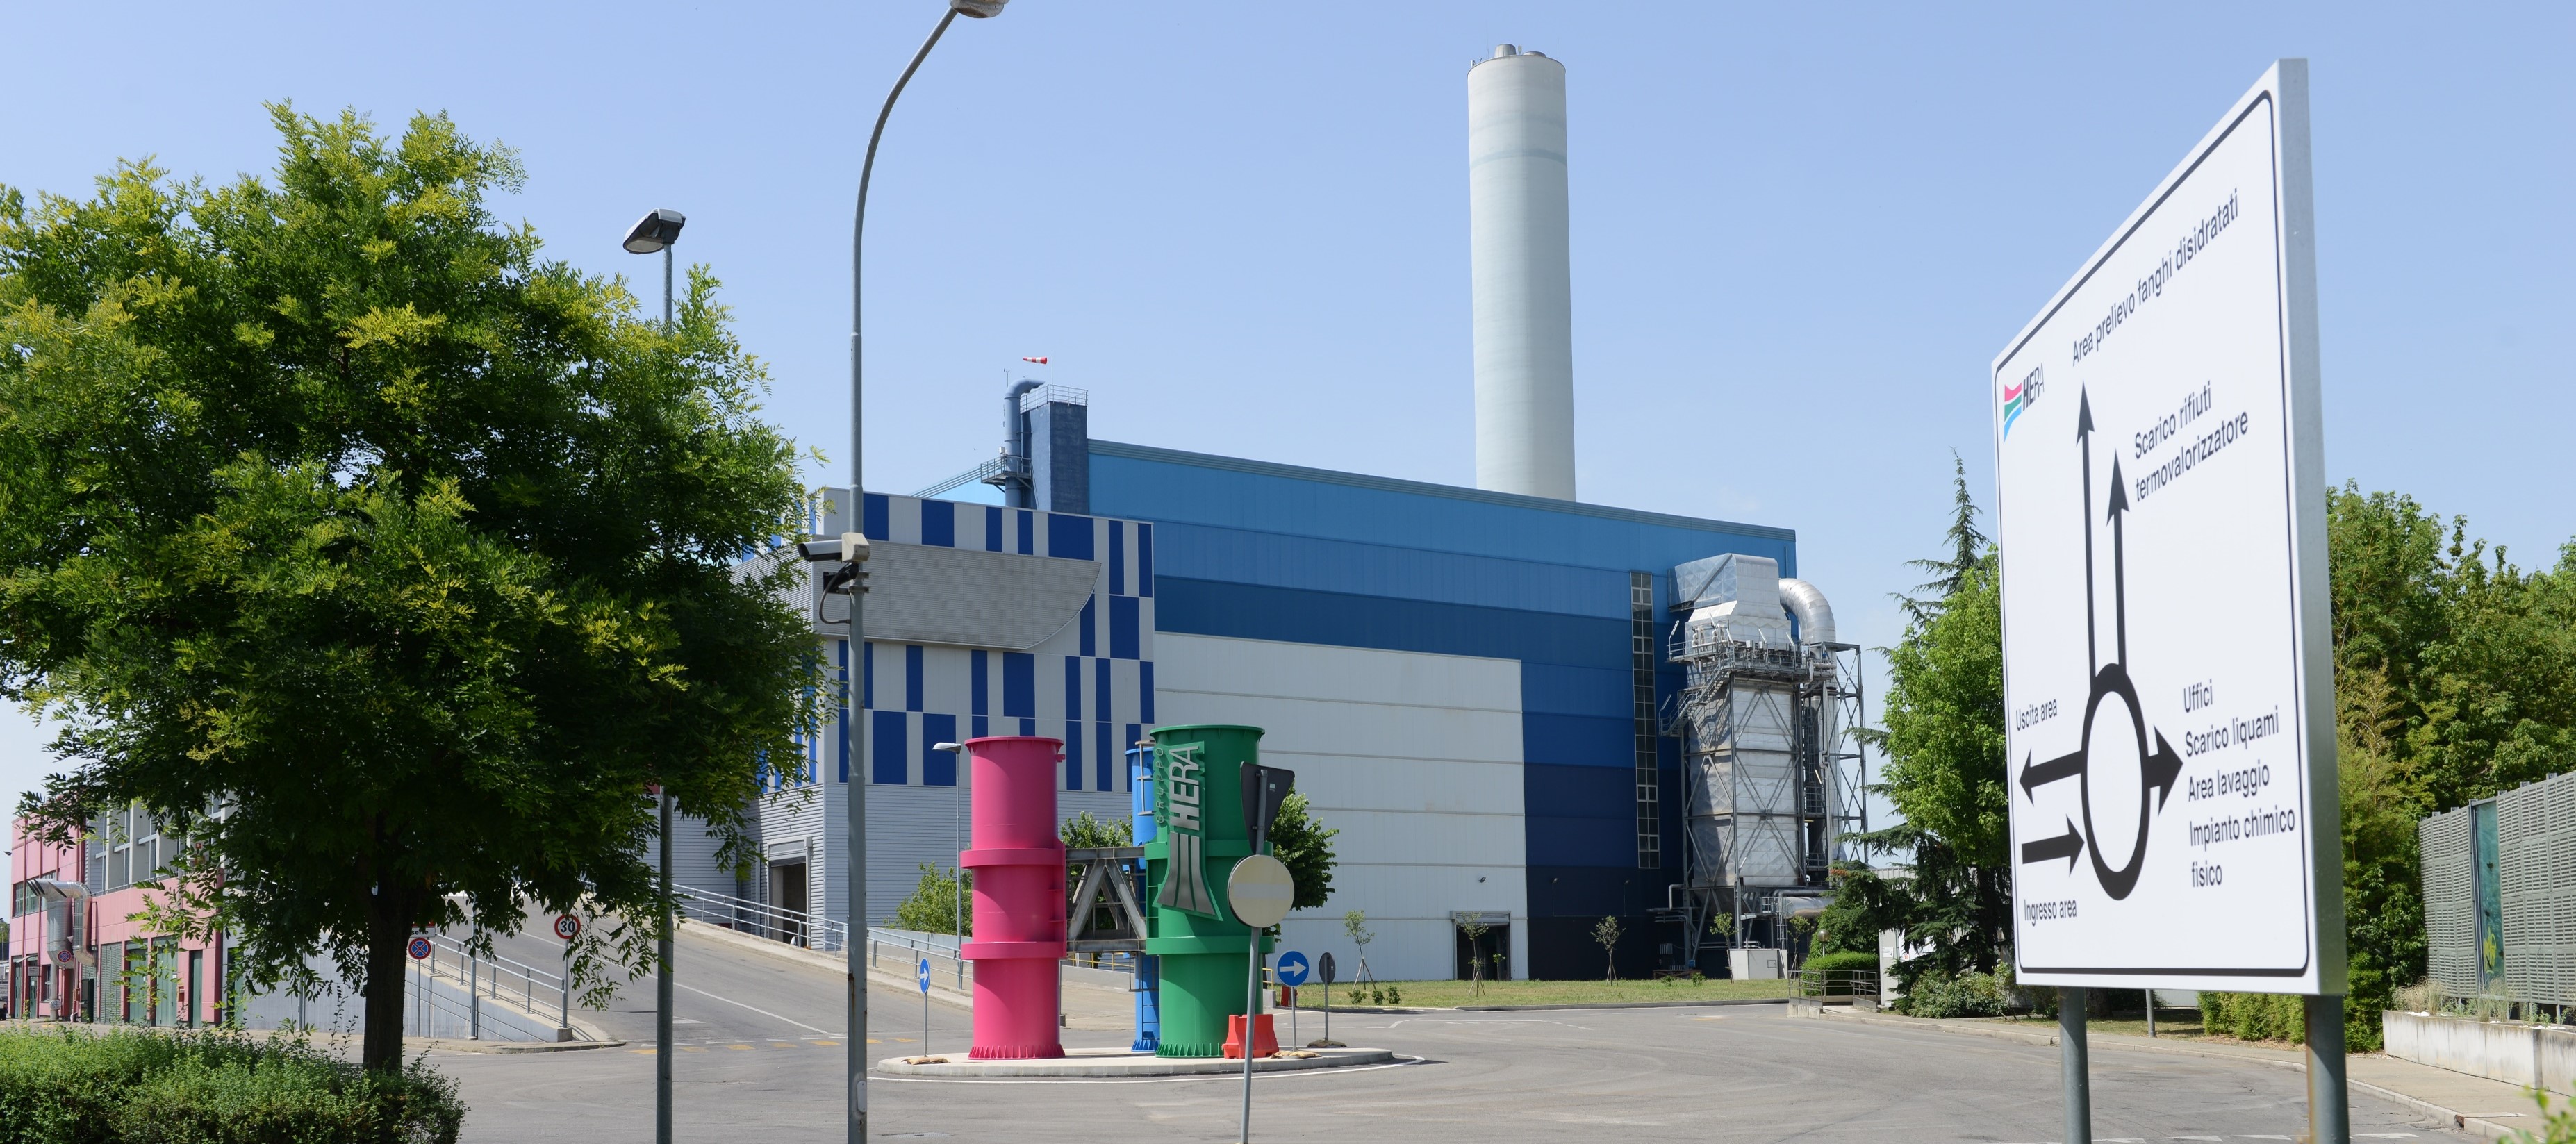
The waste to energy plant is located in Modena in Via Cavazza 45 and is part of a multifunctional hub. The hub also includes a physical/chemical treatment plant for liquid waste managed by Herambiente S.p.A. and of the wastewater treatment plant for the city of Modena managed by Hera S.p.A. The first two lines of the plant, each with a capacity of 140 tons per day, entered into operation in 1980. Subsequently, a third line was built according to the criteria provided for by Presidential Decree 915/82 and with a nominal capacity of 250 tons per day. When the plant came into operation in the early 1990s, the total annual maximum amount of treatable municipal solid waste was 140,000 tonnes per year, while the maximum amount of treatable medical waste did not exceed 5,000 tonnes per year. The lines described above were decommissioned in September 2009 and definitively demolished between May and December 2011 to make way for the new plant. The fourth line was launched in December 2008 for functional testing and in April 2009 for testing with waste. It became fully operational a year later. Page updated on dd/month/yyyy
Plant specifications
Environmental compatibility in compliance with regulations in force (Legislative Decree 152/06)
-
Number of waste to energy lines
1 -
Total thermal capacity
about 78 MWt -
Combustion technology
water cooled moving grate furnaces -
Waste disposal capacity
max 650 tonnes/day with net calorific value (NCV) equal to 10,465 kcal/kg -
Annual operation
7,500 hours -
Nominal electric power
18.6 MWe -
Recovery operation
R1 -
Type of waste accepted
municipal waste; non hazardous special waste
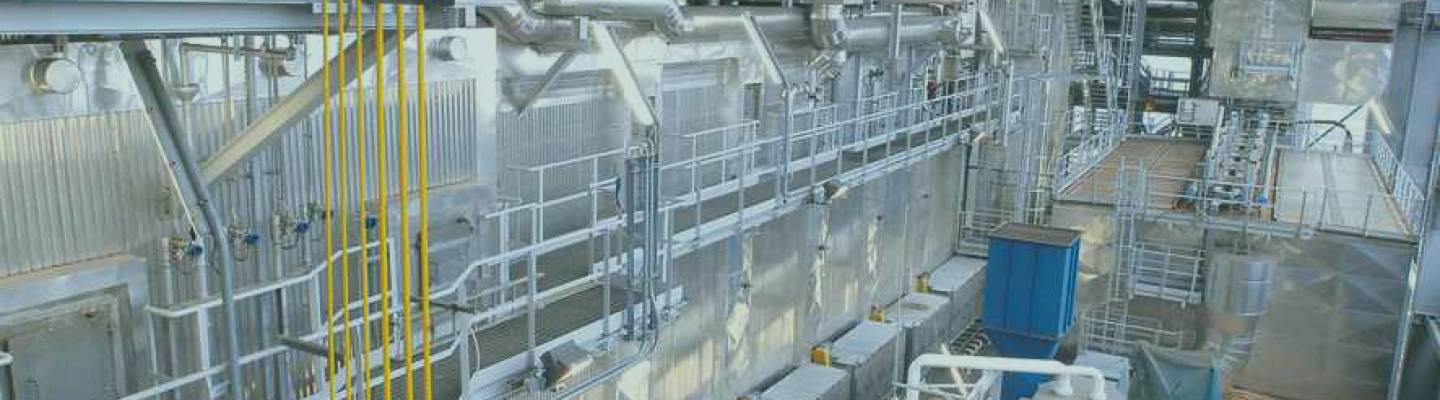
Technology
How is the plant built?
The plant as a whole currently has the following configuration: a waste receiving, storage and feeding section; a combustion line with a mobile grate furnace equipped with a recovery boiler and flue gas cleaning system; and a power generation plant set up for thermal energy recovery.