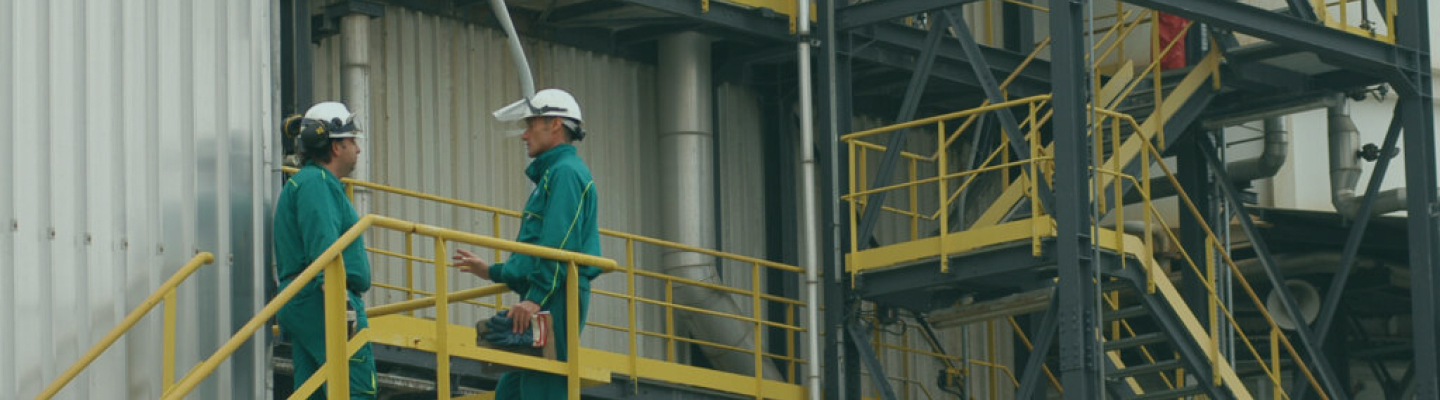
Overview
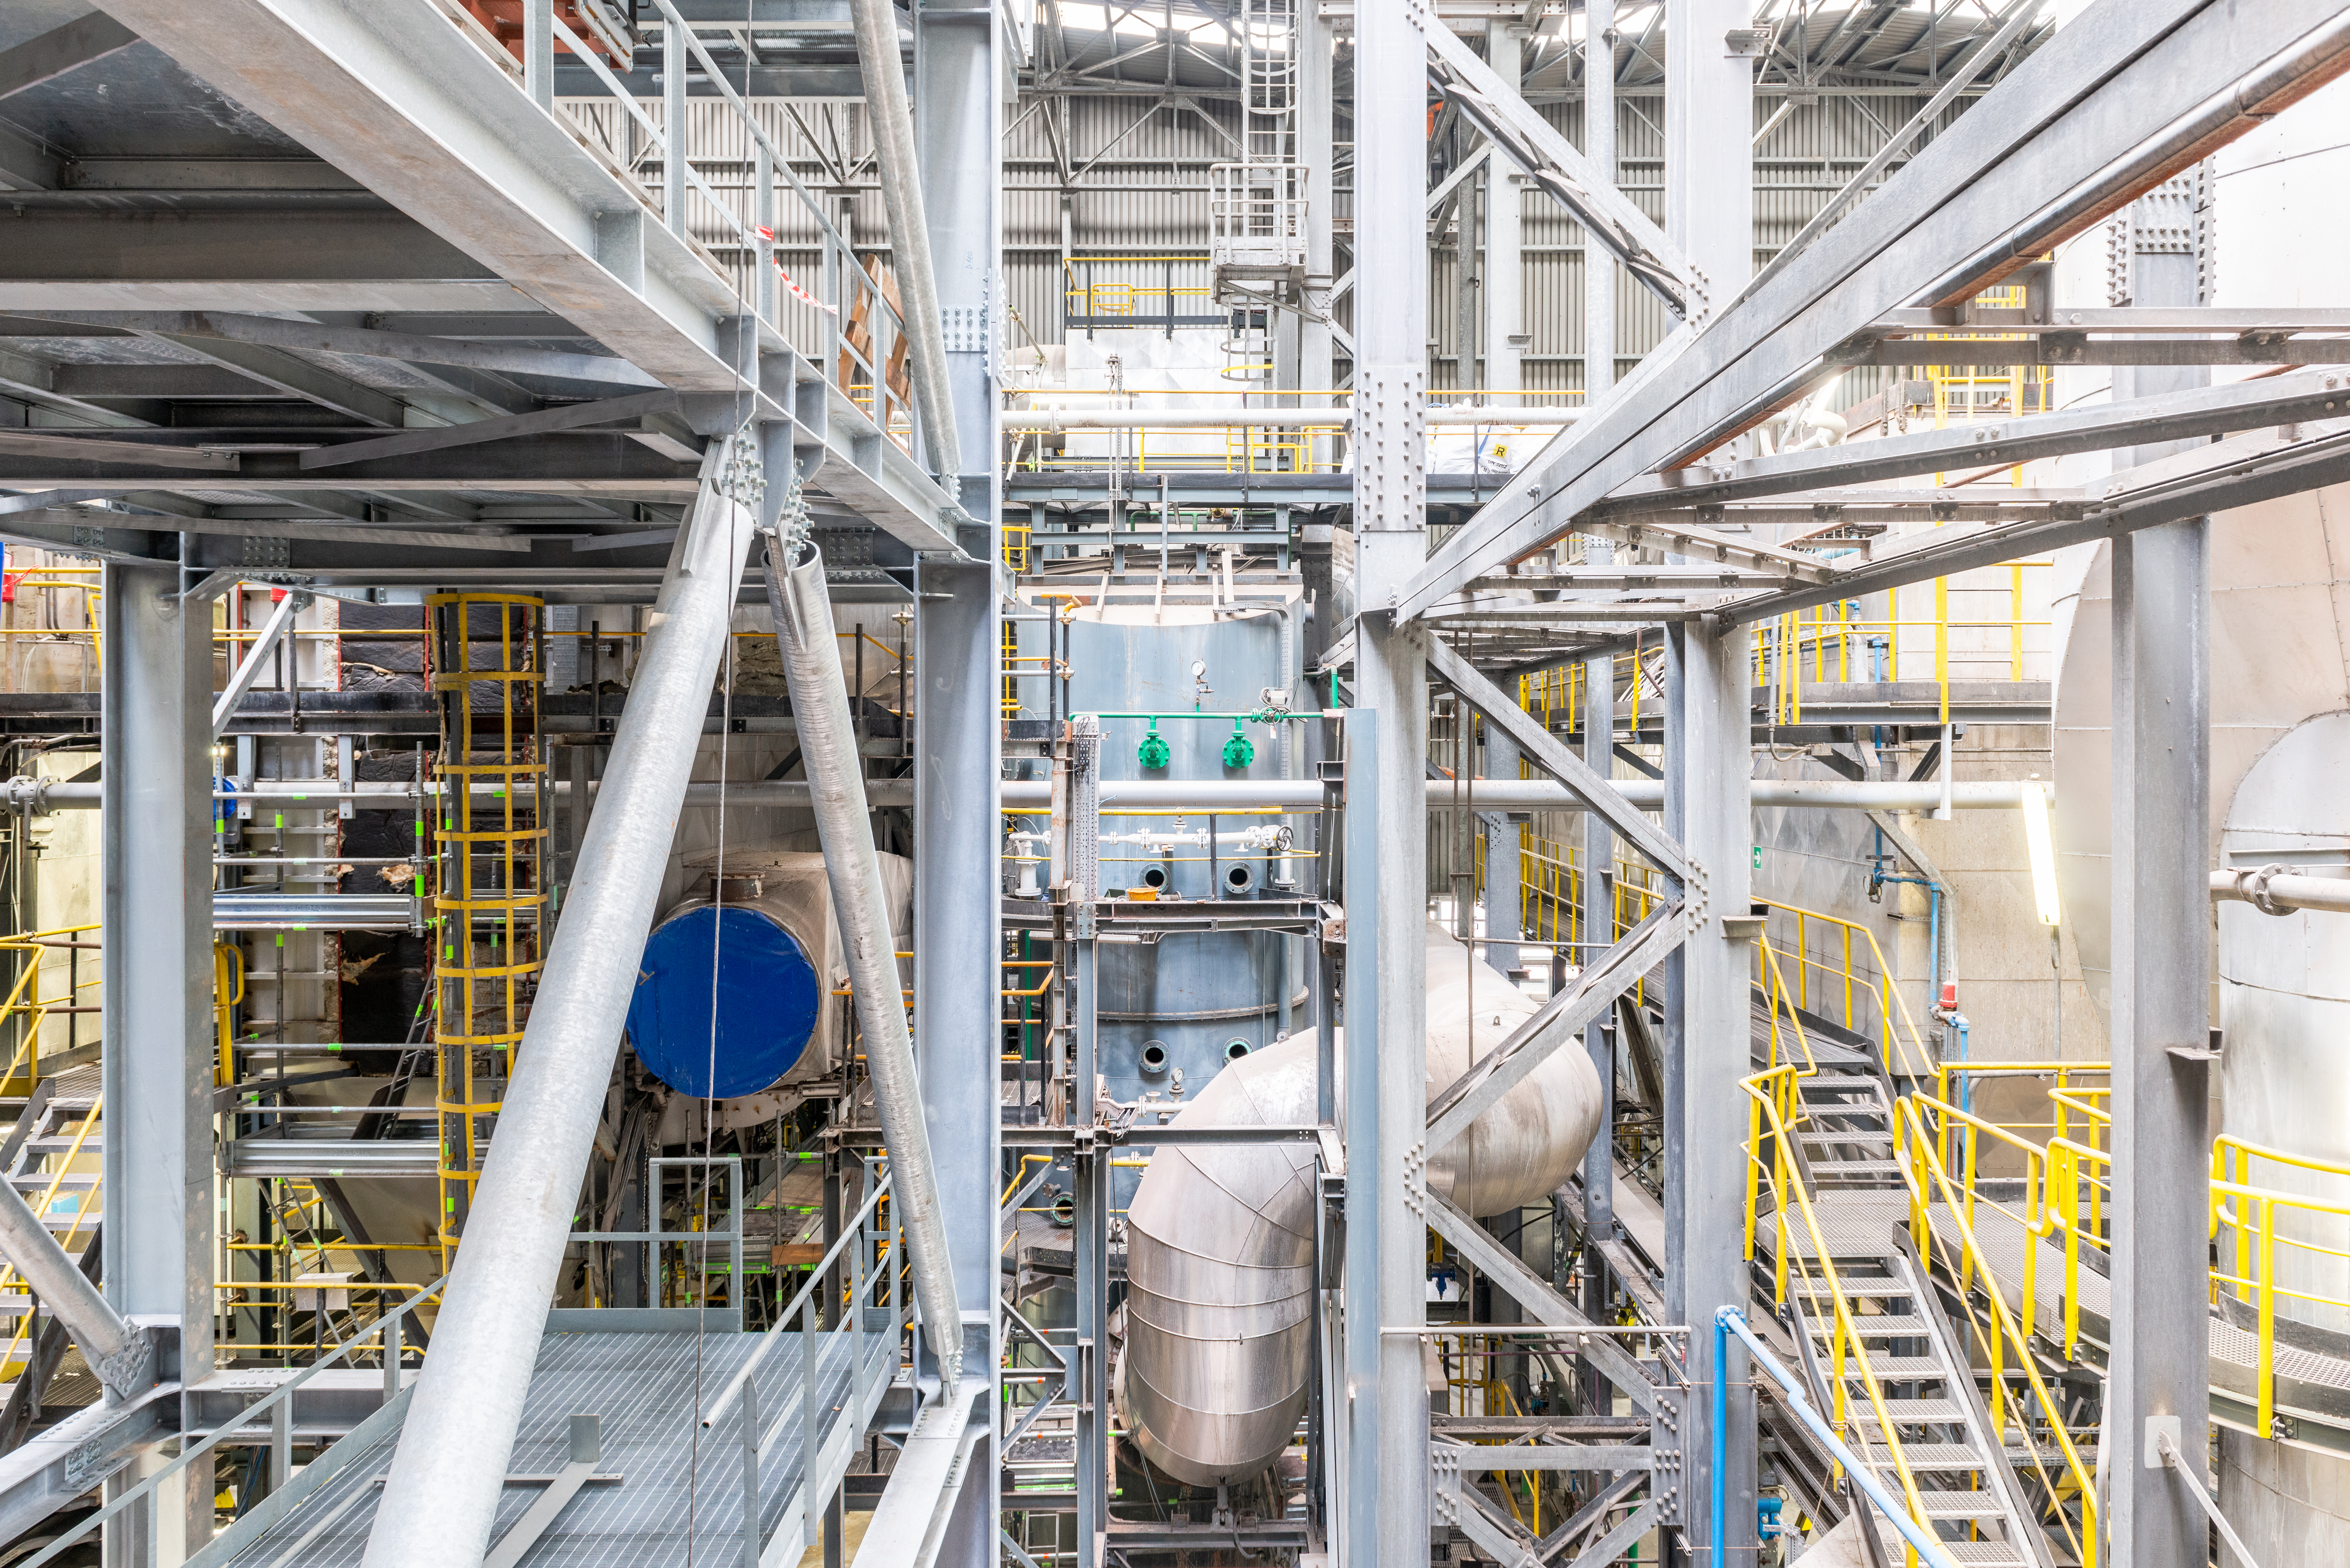
The city of Trieste, currently served by the plant known as "Errera 3", has a very long tradition of waste management using energy recovery plants. The local story in the daily newspaper "Il Piccolo" on 23 February 1915 was already talking about the inauguration of a "waste incinerator", which for the modest sum of 1 million crowns was already designed in those days for energy recovery. After a long break, in 1972 the new Giarizzole incinerator was launched, which served the city of Trieste until the end of 1999. In the meantime, legislative changes induced the Trieste Municipality to speed up the building of new waste incineration plant with energy recovery, which incorporated the best technologies available. The "ERRERA2" waste to energy plant was constructed on two incineration lines with a capacity of 204 t/day each and a thermal cycle dedicate to energy recovery serving a 4.85 MW steam turbine capable of producing 32 GWh/year of electricity. This plant made it possible to respond to the needs of an area which, because it is densely populated, limited in size and includes a limestone plateau region, made it and still makes it exceedingly difficult to locate a landfill there. "Errera 3" was the natural development from "Errera 2". The original plant was modernised and altered by constructing a third line (also with a capacity of 204 t/day) for waste treatment and an entirely new thermal cycle to cover all three energy recovery lines servicing a 14.9 MW steam turbine capable of producing 90 GWh/year.
Page updated 25 August 2015
Forms
Environmental compatibility in compliance with current legislation (Legislative Decree 152/06)
-
Number of waste to energy lines
3 -
Total thermal capacity
67,3 MWt -
Combustion technology
Mixed water/air cooled moving grate incinerators -
Waste disposal capacity
approx. 612 t/d with LCV of 9,544 kJ/kg -
Annual operation
7,500 hours -
Nominal electric power
14,9 MWe -
Disposal and recovery codes
D10; R1 -
Type of waste accepted
Urban waste, special non hazardous waste
- the steam generator on Line 1 has a capacity of approximately 29 t/h of steam at a temperature of 380 gradiC and a pressure of 39 bar (23.9 MWt);
- the steam generator on Line 2 has a capacity of 21 t/h of steam at a temperature of 380 gradiC and a pressure of 39 bar (21.7 MWt);
- the steam generator on Line 3 has a capacity of 26 t/h of steam at a temperature of 380 gradiC and a pressure of 39 bar (21.7 MWt).
- reduction of the nitrogen oxides through SNCR DeNox (Selective Non Catalytic Reduction) using urea;
- treatment of acid gases through the injection of sodium bicarbonate in a dry reactor. The sodium bicarbonate is injected by means of a pneumatic transport system which can inject up to 150 kg/h arriving at a rate of 400 kg/h through the reserve system;
- injection of activated carbon into the dry reactor to reduce the micro pollutants and heavy metals which has an injection capacity of up to 30 kg/h;
- dust removal through a bag filter made up of four modules with 240 bags each making a total of 960 bags for each line. The total filtration area is 1,819 m2;
- single stage cleaning column with the injection of a soda solution for the removal of traces of acid gases and heavy metals still present in the fumes;
- fume post heating at a temperature of 120 gradiC through a fume fume heat exchanger with an anti plume function;
- release of the fumes into the atmosphere via extraction fans and a chimney with three flues (height 100 m; flue diameter 1.4 m).
A continuous monitoring system, installed on the chimney, analyses all the main parameters at one minute intervals, then stores and logs them according to national laws. The data are transmitted to the controlling bodies. All testing equipment is certified by TÜV (German Certification Body), in order to offer the best guarantees of quality and reliability. The continuously monitored parameters are: CO (carbon monoxide), CO2 (carbon dioxide), SPM (suspended particulate matter), SOx (sulfur oxides), NOx (nitrogen oxides), NH3 (ammonia), HF (hydrogen fluoride), HCl (hydrochloric acid), TOC (total organic carbon), O2 (oxygen), temperature, humidity and fumes pressure. Periodically, further tests are carried out with direct sampling in the chimney, using instruments and methods provided for by law; these measurements are performed by accredited laboratories. It should be noted that the limit values prescribed for atmospheric emissions by local authorities are much more restrictive than those established at national level. Since 2009, the control over emissions to the atmosphere has been increased through sampling and the discontinuous analysis of PCDD + PCDF (dioxins) and Hg (mercury) parameters. Furthermore, a backup system for gas analysis at the chimney has been installed, guaranteeing continuous monitoring also in case of main system failure.
Emissions report average values of the last half hour
Type of emission | Average values | Status | ||
0 | 60 | 60 | OK | |
0,45 | 200 | 200 | OK | |
158,66 | 400 | 400 | OK | |
0 | 4 | 4 | OK | |
0 | 30 | 30 | OK | |
0 | 20 | 20 | OK | |
7,09 | 100 | 100 | OK |
Emissions report average daily values
10 | 50 | 50 | 200 | 1 | 10 | 10 | - | ||||||||||||||||||||||||||||||||||||||||||||||||||||||||||||||||||||||||||||||||||||||||||||
10 | 50 | 50 | 200 | 1 | 10 | 10 | - | ||||||||||||||||||||||||||||||||||||||||||||||||||||||||||||||||||||||||||||||||||||||||||||
18/04/2024 | Impianto fermo | ||||||||||||||||||||||||||||||||||||||||||||||||||||||||||||||||||||||||||||||||||||||||||||||||||
17/04/2024 | Impianto fermo | ||||||||||||||||||||||||||||||||||||||||||||||||||||||||||||||||||||||||||||||||||||||||||||||||||
16/04/2024 | Impianto fermo | ||||||||||||||||||||||||||||||||||||||||||||||||||||||||||||||||||||||||||||||||||||||||||||||||||
15/04/2024 | Impianto fermo | ||||||||||||||||||||||||||||||||||||||||||||||||||||||||||||||||||||||||||||||||||||||||||||||||||
14/04/2024 | Impianto fermo | ||||||||||||||||||||||||||||||||||||||||||||||||||||||||||||||||||||||||||||||||||||||||||||||||||
13/04/2024 | Impianto fermo | ||||||||||||||||||||||||||||||||||||||||||||||||||||||||||||||||||||||||||||||||||||||||||||||||||
12/04/2024 | Impianto fermo | ||||||||||||||||||||||||||||||||||||||||||||||||||||||||||||||||||||||||||||||||||||||||||||||||||
11/04/2024 | Impianto fermo | ||||||||||||||||||||||||||||||||||||||||||||||||||||||||||||||||||||||||||||||||||||||||||||||||||
10/04/2024 | Impianto fermo | ||||||||||||||||||||||||||||||||||||||||||||||||||||||||||||||||||||||||||||||||||||||||||||||||||
09/04/2024 | Impianto fermo |
Select the year
Periodic self-checks for micropollutants - Year 2022
TIPO EMISSIONE | Linea 1 | limiti aia | Limiti 152/06 |
Cd+Tl (mg/Nm3) | 0,00007 | 0,05 | 0,05 |
Hg (mg/Nm3) | 0,00003 | 0,05 | 0,05 |
Metalli (mg/Nm3) | 0,020 | 0,5 | 0,5 |
Diossine (ng/Nm3) | 0,0011 | 0,1 | 0,1 |
IPA (mg/Nm3) | 0,00002 | 0,01 | 0,01 |
PCB (ng/Nm3) | 0,00037 | 0,1 | 0,1 |
Select the year
Emissions report average values of the last half hour
Type of emission | Average values | Status | ||
0,2 | 60 | 60 | OK | |
0 | 200 | 200 | OK | |
119,03 | 400 | 400 | OK | |
0,08 | 4 | 4 | OK | |
0 | 30 | 30 | OK | |
0 | 20 | 20 | OK | |
1,32 | 100 | 100 | OK |
Emissions report average daily values
10 | 50 | 50 | 200 | 1 | 10 | 10 | - | ||||||||||||||||||||||||||||||||||||||||||||||||||||||||||||||||||||||||||||||||||||||||||||
10 | 50 | 50 | 200 | 1 | 10 | 10 | - | ||||||||||||||||||||||||||||||||||||||||||||||||||||||||||||||||||||||||||||||||||||||||||||
18/04/2024 | Impianto in avviamento o fermata | ||||||||||||||||||||||||||||||||||||||||||||||||||||||||||||||||||||||||||||||||||||||||||||||||||
17/04/2024 | 0,49 | 7,23 | 0,94 | 131,04 | 0,08 | 0 | 0 | 56.091,62 | |||||||||||||||||||||||||||||||||||||||||||||||||||||||||||||||||||||||||||||||||||||||||||
16/04/2024 | 0,63 | 6,53 | 1,69 | 141,82 | 0,08 | 0 | 0,14 | 55.362,08 | |||||||||||||||||||||||||||||||||||||||||||||||||||||||||||||||||||||||||||||||||||||||||||
15/04/2024 | 0,95 | 12,81 | 2,76 | 147,09 | 0,09 | 0 | 0,01 | 55.612,83 | |||||||||||||||||||||||||||||||||||||||||||||||||||||||||||||||||||||||||||||||||||||||||||
14/04/2024 | 1,09 | 6,16 | 8,75 | 141,14 | 0,08 | 0 | 0 | 54.766,59 | |||||||||||||||||||||||||||||||||||||||||||||||||||||||||||||||||||||||||||||||||||||||||||
13/04/2024 | 0,74 | 5,29 | 2,27 | 149,34 | 0,09 | 0 | 0 | 55.477,87 | |||||||||||||||||||||||||||||||||||||||||||||||||||||||||||||||||||||||||||||||||||||||||||
12/04/2024 | 0,74 | 8,06 | 2,2 | 146,85 | 0,09 | 0 | 0 | 55.979,42 | |||||||||||||||||||||||||||||||||||||||||||||||||||||||||||||||||||||||||||||||||||||||||||
11/04/2024 | 0,59 | 8,57 | 1,98 | 131,49 | 0,09 | 0 | 0 | 55.648,3 | |||||||||||||||||||||||||||||||||||||||||||||||||||||||||||||||||||||||||||||||||||||||||||
10/04/2024 | 0,59 | 13,73 | 1,74 | 121,84 | 0,08 | 0 | 0,23 | 54.423,86 | |||||||||||||||||||||||||||||||||||||||||||||||||||||||||||||||||||||||||||||||||||||||||||
09/04/2024 | 0,58 | 6,7 | 1,55 | 123,94 | 0,09 | 0 | 0 | 56.246,01 |
Select the year
Periodic self-checks for micropollutants - Year 2021
TIPO EMISSIONE | Linea 2 | limiti aia | Limiti 152/06 |
Cd+Tl (mg/Nm3) | 0,00002 | 0,05 | 0,05 |
Hg (mg/Nm3) | 0,00030 | 0,05 | 0,05 |
Metalli (mg/Nm3) | 0,005 | 0,5 | 0,5 |
Diossine (ng/Nm3) | 0,0018 | 0,1 | 0,1 |
IPA (mg/Nm3) | 0,00010 | 0,01 | 0,01 |
PCB (ng/Nm3) | 0,00066 | 0,1 | 0,1 |
Select the year
Emissions report average values of the last half hour
Type of emission | Average values | Status | ||
0,5 | 60 | 60 | OK | |
0,08 | 200 | 200 | OK | |
142,71 | 400 | 400 | OK | |
0,1 | 4 | 4 | OK | |
0 | 30 | 30 | OK | |
0,77 | 20 | 20 | OK | |
9,89 | 100 | 100 | OK |
Emissions report average daily values
10 | 50 | 50 | 200 | 1 | 10 | 10 | - | ||||||||||||||||||||||||||||||||||||||||||||||||||||||||||||||||||||||||||||||||||||||||||||
10 | 50 | 50 | 200 | 1 | 10 | 10 | - | ||||||||||||||||||||||||||||||||||||||||||||||||||||||||||||||||||||||||||||||||||||||||||||
18/04/2024 | Impianto in avviamento o fermata | ||||||||||||||||||||||||||||||||||||||||||||||||||||||||||||||||||||||||||||||||||||||||||||||||||
17/04/2024 | 1,11 | 14,9 | 0,72 | 147,5 | 0,1 | 0 | 1,2 | 54.343,93 | |||||||||||||||||||||||||||||||||||||||||||||||||||||||||||||||||||||||||||||||||||||||||||
16/04/2024 | 2,2 | 14,72 | 0,35 | 156,17 | 0,1 | 0 | 0,95 | 54.383,38 | |||||||||||||||||||||||||||||||||||||||||||||||||||||||||||||||||||||||||||||||||||||||||||
15/04/2024 | 1,73 | 13,42 | 0,58 | 153,16 | 0,1 | 0 | 0,74 | 53.800,47 | |||||||||||||||||||||||||||||||||||||||||||||||||||||||||||||||||||||||||||||||||||||||||||
14/04/2024 | 1,36 | 18,89 | 0,4 | 147,79 | 0,09 | 0 | 0,75 | 53.073,1 | |||||||||||||||||||||||||||||||||||||||||||||||||||||||||||||||||||||||||||||||||||||||||||
13/04/2024 | 1,81 | 11,45 | 0,1 | 154,03 | 0,09 | 0 | 0,75 | 53.217,38 | |||||||||||||||||||||||||||||||||||||||||||||||||||||||||||||||||||||||||||||||||||||||||||
12/04/2024 | 2,08 | 12,39 | 0,78 | 152,87 | 0,09 | 0 | 0,97 | 53.545,01 | |||||||||||||||||||||||||||||||||||||||||||||||||||||||||||||||||||||||||||||||||||||||||||
11/04/2024 | 1,86 | 8,43 | 0,74 | 151,45 | 0,09 | 0 | 0,56 | 53.211,08 | |||||||||||||||||||||||||||||||||||||||||||||||||||||||||||||||||||||||||||||||||||||||||||
10/04/2024 | 1,77 | 9,22 | 0,43 | 146,38 | 0,09 | 0 | 0,64 | 53.387,61 | |||||||||||||||||||||||||||||||||||||||||||||||||||||||||||||||||||||||||||||||||||||||||||
09/04/2024 | 1,71 | 9,54 | 0,7 | 147,76 | 0,09 | 0 | 0,72 | 53.218,27 |
Select the year
Periodic self-checks for micropollutants - Year 2022
TIPO EMISSIONE | Linea 3 | limiti aia | Limiti 152/06 |
Cd+Tl (mg/Nm3) | 0,00011 | 0,05 | 0,05 |
Hg (mg/Nm3) | 0,00003 | 0,05 | 0,05 |
Metalli (mg/Nm3) | 0,037 | 0,5 | 0,5 |
Diossine (ng/Nm3) | 0,0016 | 0,1 | 0,1 |
IPA (mg/Nm3) | 0,00002 | 0,01 | 0,01 |
PCB (ng/Nm3) | 0,00044 | 0,1 | 0,1 |