-
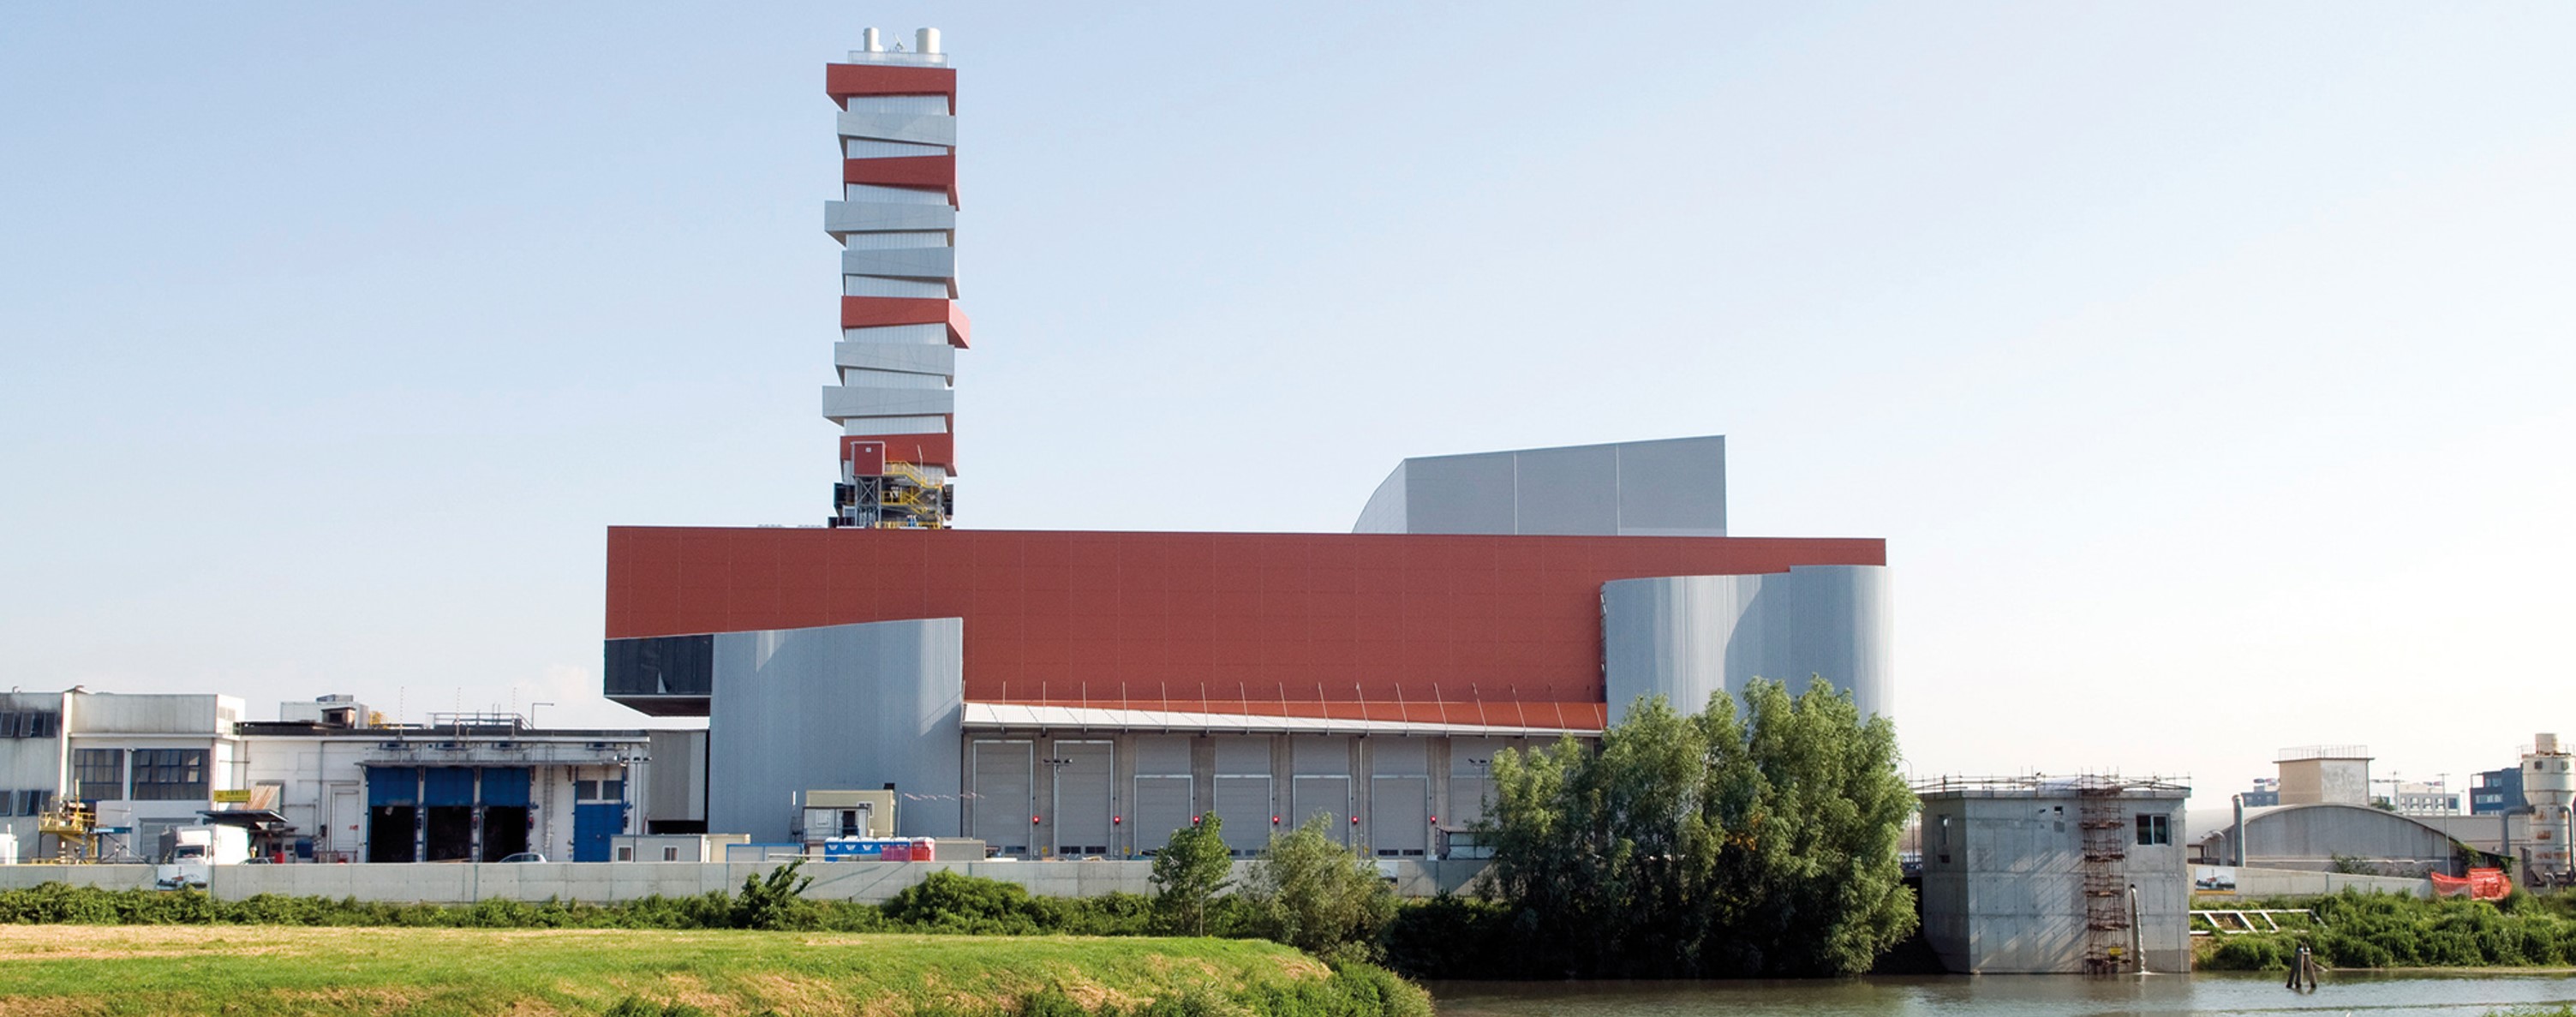
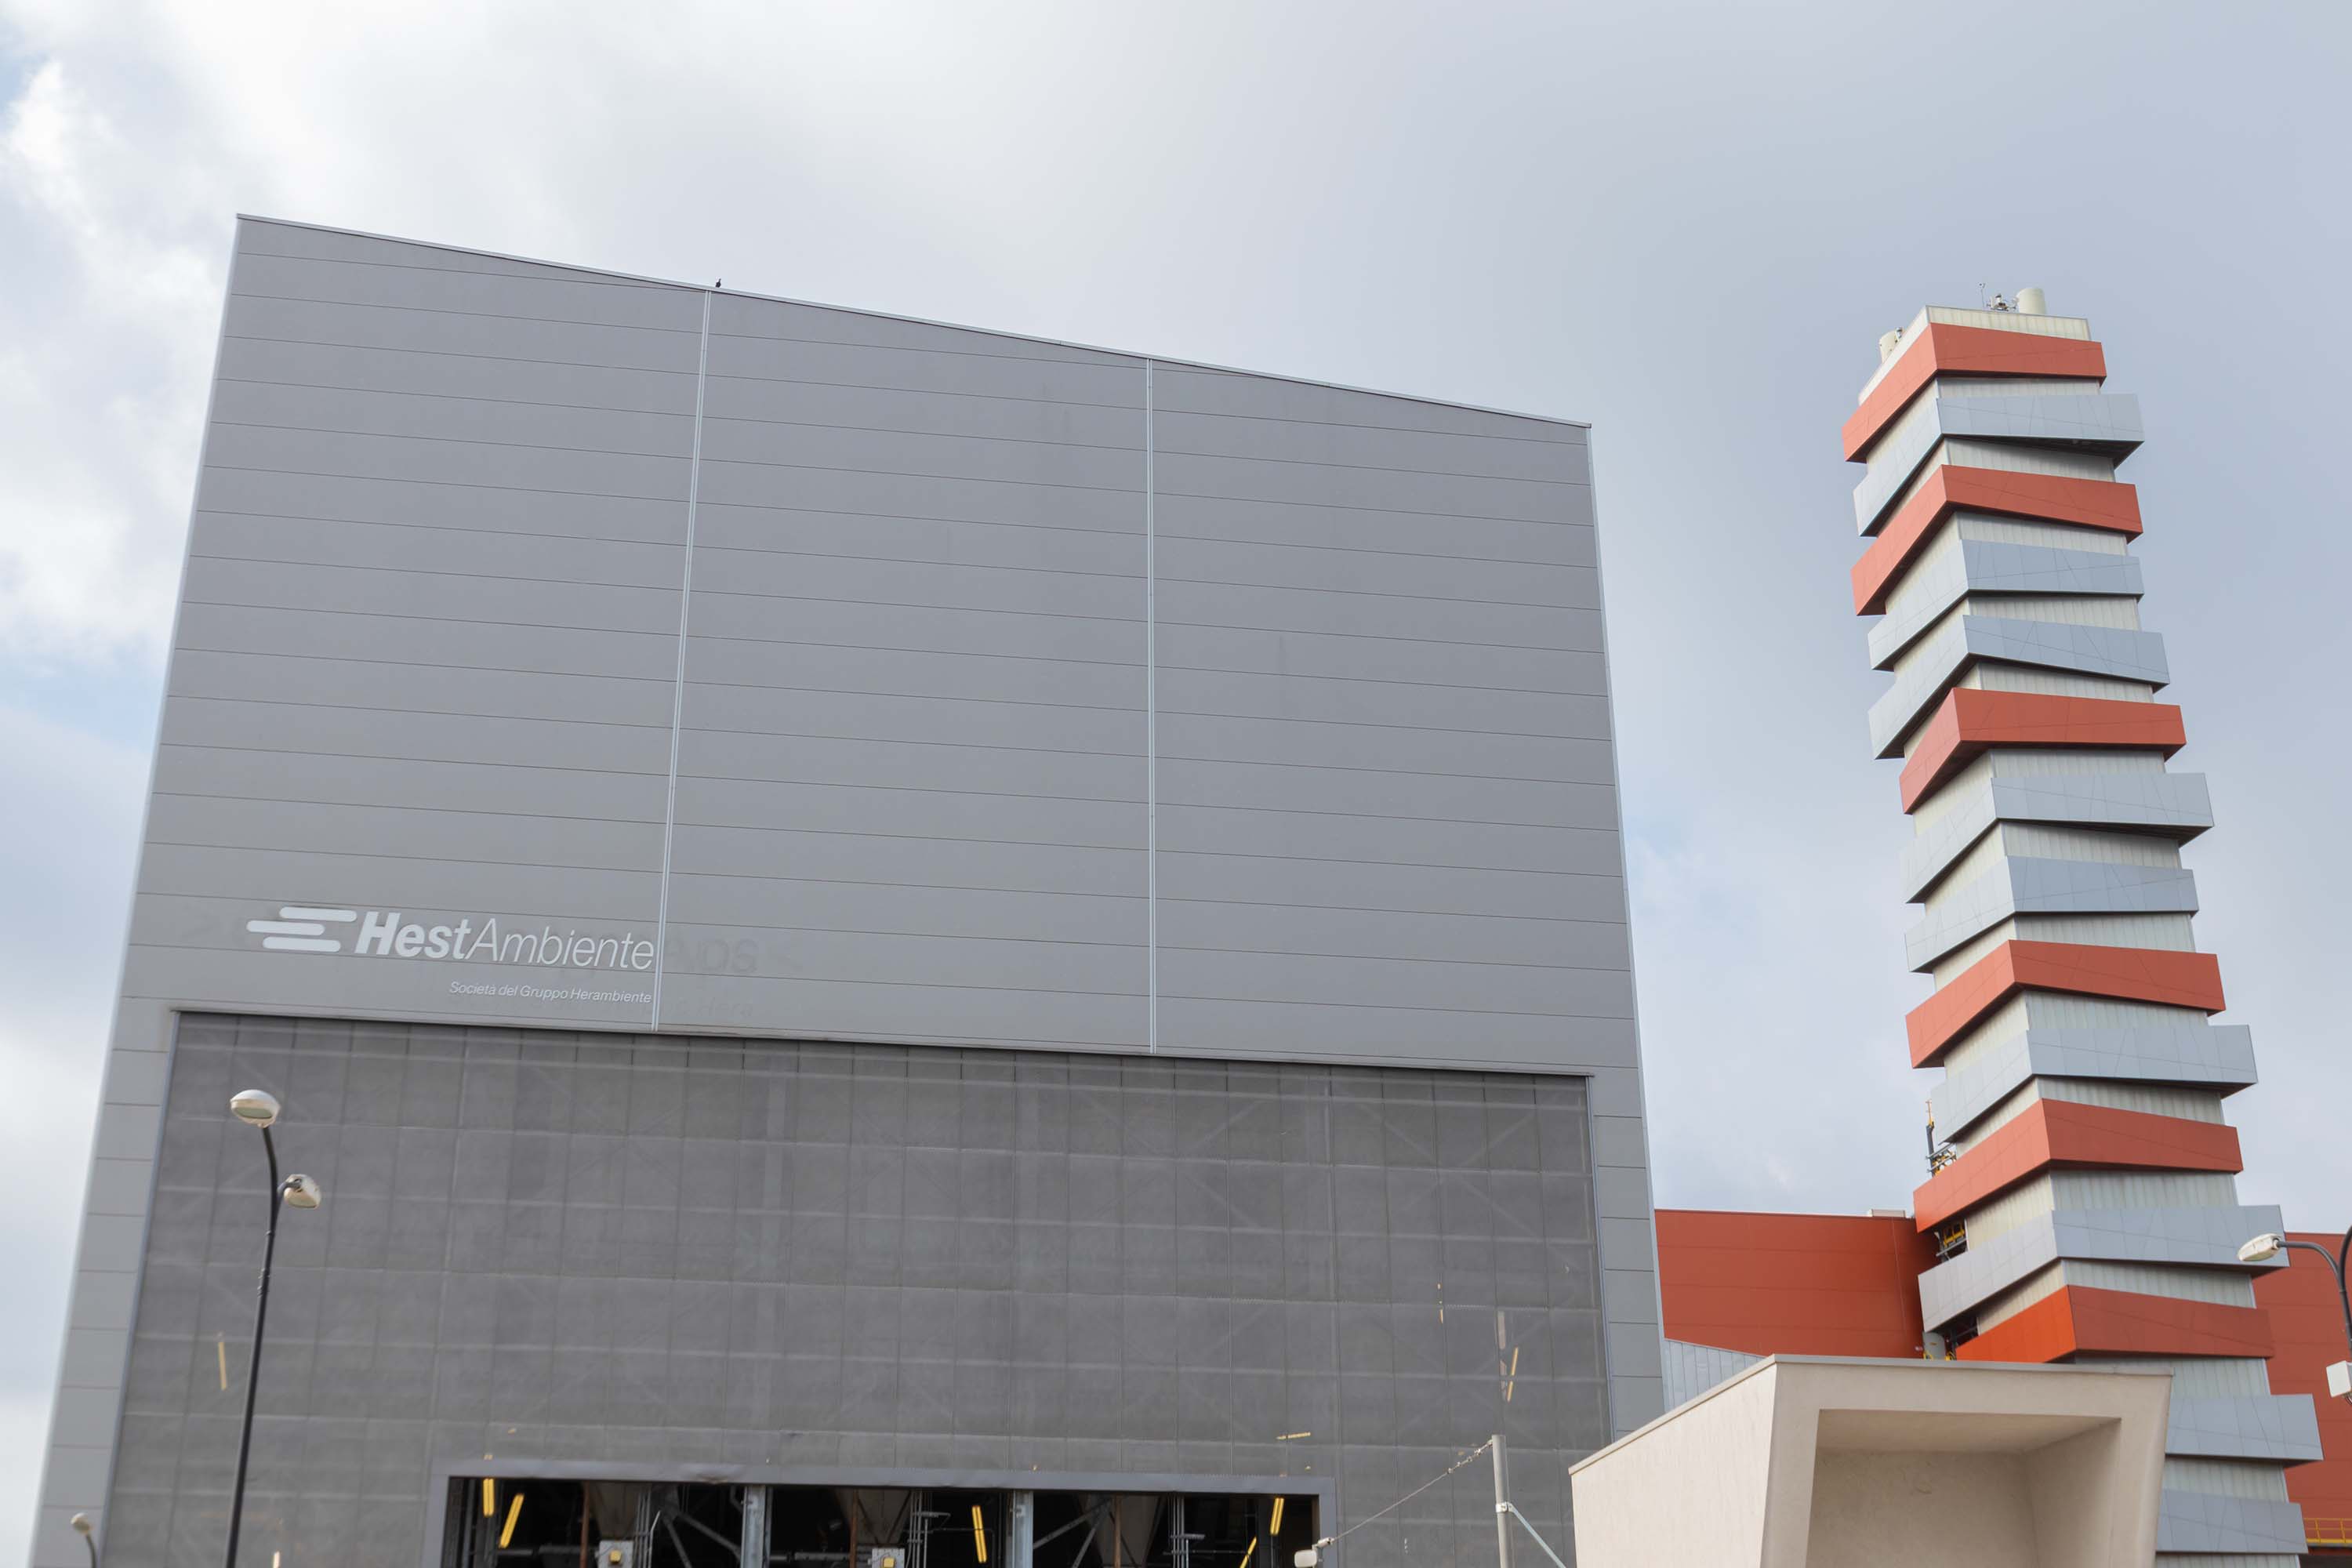
Waste to energy plant in Padua
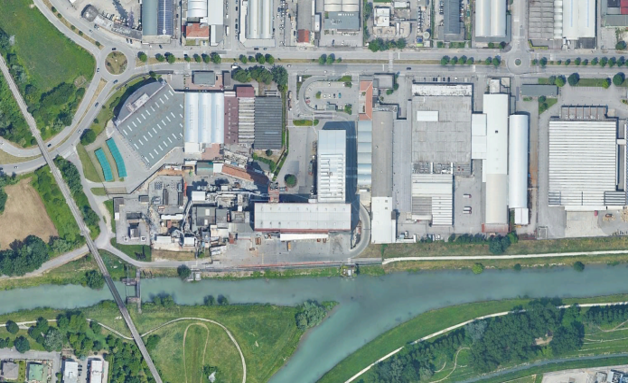
Hestambiente <br> Viale della Navigazione Interna 34, Padua
Waste-to-energy
Municipal waste, special non-hazardous and sanitary waste with infectious risk
-
Hestambiente <br> Viale della Navigazione Interna 34, Padua
Waste-to-energy
Municipal waste, special non-hazardous and sanitary waste with infectious risk
-
Hestambiente <br> Viale della Navigazione Interna 34, Padua
Waste-to-energy
Municipal waste, special non-hazardous and sanitary waste with infectious risk
-
Hestambiente <br> Viale della Navigazione Interna 34, Padua
Waste-to-energy
Municipal waste, special non-hazardous and sanitary waste with infectious risk
-
Hestambiente <br> Viale della Navigazione Interna 34, Padua
Waste-to-energy
Municipal waste, special non-hazardous and sanitary waste with infectious risk
-
Hestambiente <br> Viale della Navigazione Interna 34, Padua
Waste-to-energy
Municipal waste, special non-hazardous and sanitary waste with infectious risk
-
Hestambiente <br> Viale della Navigazione Interna 34, Padua
Waste-to-energy
Municipal waste, special non-hazardous and sanitary waste with infectious risk
Overview
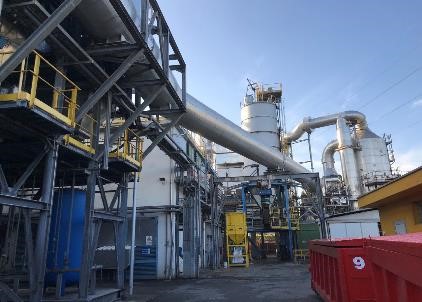
The first waste to energy plant in Padua was built in the San Lazzaro district in the 50s and became operational in 1962. It was a real innovation at the time: the first Italian plant where energy was recovered. The nominal capacity of the incinerator was 140 t/day and the boiler and thermal unit generated 1.4 MWh/day. A second combustion line with a capacity of 150 t/day was built at the end of the 60s and later updated to adapt it to the regulations and inspections until it took on its final layout in 2000.
The waste to energy plant currently comprises three modernised incineration lines integrated with the third line, which began producing electricity on 18 June 2010.
Page update 3 June 2021
Form
Environmental compatibility in compliance with regulations in force (Legislative Decree 152/06)
-
Number of waste to energy lines
3 -
Total thermal capacity
79,8 MWt -
Combustion technology
moving grate furnaces with water/air cooling (L3) and air (L1 and L2) -
Waste disposal capacity
about 600 t/g (with NCV =3000 kcal/kg for L3 and 2500 kcal/kg for L1 and L2) -
Annual operation
about 7,500 hours -
Nominal electric power
18,3 MWe -
Disposal and recovery codes
R1 -
Type of waste accepted
Municipal waste, special non hazardous waste and hospital waste with infection risk